2

There seem to be too many points clustered around negative values for all the plots And while 3 & 4 seem to have random enough patterns, 1 & 2 seems to have negatively sloped trend.

If these were to violate linearity and homogeneity assumption, I should stop using the regression model, correct?

Residual plot variable 1

Residual plot variable 2

Residual plot variable 3

Residual Plot variable 4

gung - Reinstate Monica
  • 132,789
  • 81
  • 357
  • 650
palm
  • 61
  • 2

1 Answers1

5

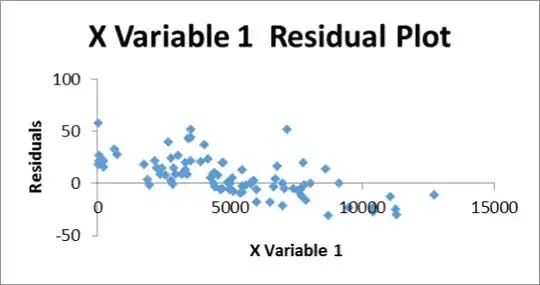
Yes, the residual plots for variables 1 & 2 are problematic. I don't necessarily see any heterogeneity of variance (heteroscedasticity), or even non-linearity, but they certainly show non-independence. You can very clearly guess if a residual will be above or below 0 based on whether its neighbors are.

I do want to clear up a small misunderstanding. You state that you think there may be too many residuals below 0. It isn't that 50% of the residuals must be <0, and 50% above, rather the assumption is that the mean of the residuals is 0. If you have some skew in the distribution of the residuals, the mean won't equal the median, and you can validly have different numbers greater or less than 0.

I am perplexed, though. The OLS algorithm should ensure that what you see in your top two plots does not happen in regression. What code / program did you use to fit the data and generate these residuals? Did you force the intercept to be 0? That is the only thing I can think of that would produce the plots you show.

gung - Reinstate Monica
  • 132,789
  • 81
  • 357
  • 650
  • Thank you very much for your quick reply, and also the clarification on the mean of residuals. I actually simply use excel regression option in data analysis. And I did force the intercept to be 0. Is that something that I should not do? – palm May 23 '14 at 04:23
  • Yeah, that's something you should not do; see here: [When is it OK to remove the intercept in regression?](http://stats.stackexchange.com/q/7948/7290) – gung - Reinstate Monica May 23 '14 at 04:28
  • palm - you should avoid doing it unless there's a very strong reason not to (like you know for certain it must be 0). And if you did think you knew that for certain, those plots are saying "what you think you know ain't so". – Glen_b May 23 '14 at 04:28
  • Appreciate it a lot gun and Glen_b. If you don't mind, could I ask you two other quick questions?
    1.) I am trying to predict productivity of finishing a task in the warehouse using quantity of work (# of pcs to do) and ratio of pcs/SKU. pcs and pcs/SKU both contains same information, # of pcs. Is this a violation of independent variables?
    2.) do both y and x variables need to be normally distributed? I believe p-value assume normality?
    – palm May 23 '14 at 04:45
  • 1
    palm -- it sounds like you should post a new question. I couldn't really follow that first one, but if it's asking what I think, note that "independent variables" aren't actually independent. It (the dependent/independent thing for y and x) is a terminology I detest, actually, for this reason. On (2) neither are assumed to be normal. Many posts here discuss the issue. – Glen_b May 23 '14 at 04:49
  • 1
    Only the residuals need to be normal, not X or Y, see my answer here: [What if residuals are normal, but Y is not?](http://stats.stackexchange.com/a/33320/7290) You can have 2 variables that contain similar information, so long as it isn't *identical*, but it will make your SEs larger. It may or may not be a reasonable thing to do. – gung - Reinstate Monica May 23 '14 at 04:52
  • @gung +1 your responses were better than mine there. Thanks for the (literally) added emphasis; if I hadn't already upvoted your answer, I would now. – Glen_b May 23 '14 at 04:54
  • 1
    @palm, please register your account. – gung - Reinstate Monica May 23 '14 at 04:55
  • arghh I was derped and make another post as u suggested without waiting for more replies. anyway, i'll make an account. – palm May 23 '14 at 05:14