I just wanted to make sure I'm right here. I have a situation where I need to prove that on days where we sell more than 10 items, our margin (sale price vs. suggested price) goes up. I'm not really sure it's possible to prove this, but this is what I'm working with.
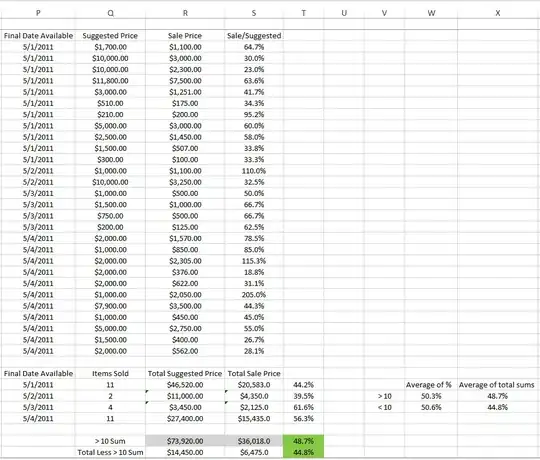
The table at the top is an itemized list of each sale we did every day. I notice that if I take a sum of column R on days with more than 10 sales (so 5/1/2011 & 5/4/2011) and divide it by the corresponding totals in column Q ($36,018/$73,920) I get 48.7% (I then take the total of all everything in each column and subtract the corresponding totals, divide it by the appropriate suggested price total- this is shown at the very bottom in column R). Is this the right approach to this? I just need to be sure.
The table at the bottom is a separate table I have that aggregates all the info from the above table. Previously I was taking an average of the corresponding percentages (so average 44.2% & 56.3%) but I realized this was likely very incorrect. I'm not completely clear on why, but I avoid taking averages of averages and this situation seemed very similar to me, so that's why I'm posting here to double check. This calculation gives me very different results (shown in column W). Why is this the wrong way?
I hope this all makes sense. I know this is one of those fundamental rules of math, yet my brain is fried right now so I need to understand fully why the second method is wrong. I'm not really seeing any analogous examples online.
(*Please also note that this is just a subset of my data. The real dataset consists of 3+ years of records and a few other data points, but this was the main one I was asked to look into, though I'm not convinced a causal relationship can be proven from this data alone.)