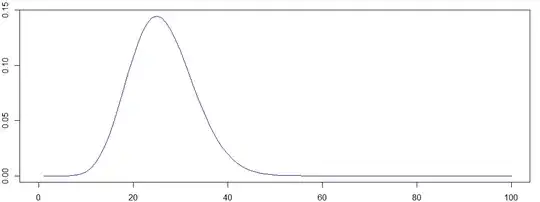
I am wondering whether someone has a tip on this potentially very basic question. i have done some grid-based bayesian analysis and ended up with a non-standard discrete posterior density function over an interval of 100 observational values (per graph) below and as shown in the vector format per below. I can easily find the corresponding value of the distribution in R (which.max) but am struggling to find a way to calculate any measure of dispersion of the probability distribution. Ideally - i would like to have a quick way of calculating in R that gives me the answer that x% of the density lies between e.g. the index values of 20 and 80; any tips very welcome...
  [1] 4.615412e-02 7.685555e-02 7.936106e-02 9.355243e-02 9.390333e-02 9.415255e-02 8.812764e-02 8.094180e-02
  [9] 7.111677e-02 6.096649e-02 5.067963e-02 4.113239e-02 3.252751e-02 2.514941e-02 1.900486e-02 1.405895e-02
 [17] 1.018350e-02 7.230007e-03 5.033092e-03 3.437899e-03 2.305284e-03 1.518504e-03 9.831581e-04 6.261243e-04
 [25] 3.925111e-04 2.424243e-04 1.476553e-04 8.878700e-05 5.277273e-05 3.104750e-05 1.810726e-05 1.048550e-05