7

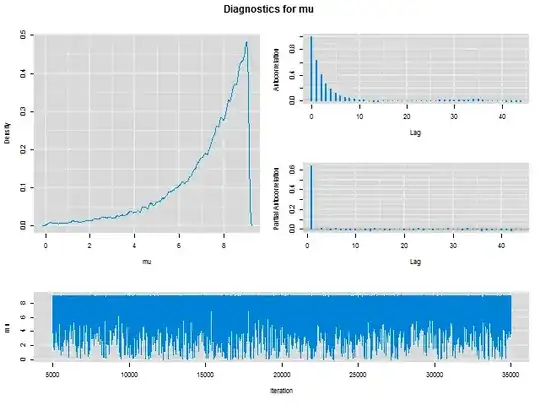
I'm trying to fit a generalised pareto distribution to a simulated dataset using JAGS and runjags. When doing so, I get very strange density and mixing plots for the mu parameter. The sigma and xi parameters are estimated as expected.

How should I interpret these plots, and proceed to fix my model? The plot and a reproducible model are below.

Diagnostics for mu

# Simulate gpd
require(evir)
N <- 1000
set.seed(1984)
x <- rgpd(N, xi = 0.5, mu = 5, beta = 2000)

# fit distribution using JAGS
require(runjags)
require(rjags)

library(mcmcplots)

model <- "model {
  for (i in 1:N) { #data# N
        x[i] ~ dgenpar(sigma, mu, xi) #data# x
    }
    mu ~ dunif(0.0001, 1e6)
  xi ~ dgamma(0.001, 0.00001)
    sigma ~ dunif(0.000001, 10000)
#monitor# sigma, mu, xi
}"

results <- run.jags(model, method="rjags", n.chains = 3, modules="runjags", inits = list(list(sigma=1, mu=5, xi=1), 
                                                                           list(sigma=5, mu=1, xi=10), 
                                                                           list(sigma=100, mu=0.1, xi=50)))
load.runjagsmodule()

mcmcplot(results, dir=getwd())

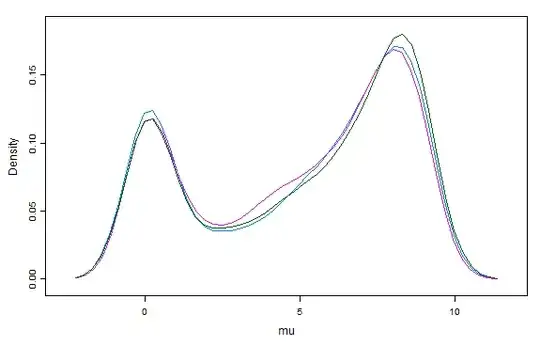
Note that increasing the chain length doesn't solve the problem. After increasing the sample from 4,000 to 400,000, the density for mu isn't anything like a unimodal distribution centred around 5: enter image description here

fmark
  • 4,666
  • 5
  • 35
  • 51
  • 1
    Just a short observation: the MCMC-Chain for $\mu$ (`mu`) is capped at the minimum of the observed value of `x` (at around 9.12). – COOLSerdash May 17 '14 at 16:19
  • Perhaps you could write out your full model specification for us? (I'm not familiar with Jags so I can't really infer it from your code). I realize it's probably trivial, but it might help. –  May 17 '14 at 20:19
  • Also, can you define what the pdf for this generalized Pareto? – Cam.Davidson.Pilon May 18 '14 at 14:05
  • 2
    @Cam.Davidson.Pilon The [`runjags`](http://cran.r-project.org/web/packages/runjags/vignettes/runjags.pdf) vignette states the PDF of the generalized pareto distribution as:$$\frac{1}{\sigma}\left(1 + \xi\left(\frac{x-\mu}{\sigma}\right)\right)^{-\left(\frac{1}{\xi}+1\right)}$$ with $\sigma>0$ and states that the lower bound is $\mu$. – COOLSerdash May 18 '14 at 17:25

1 Answers1

2

The generalised pareto distribution has the limitation that $mu < x$. Thus, the posterior density is capped at x, as COOLSerdash noted. This is intended behaviour, not a bug.

The lesser, left-most peak in the data is due to the prior distribution being incorrectly specified with a floor of zero.

fmark
  • 4,666
  • 5
  • 35
  • 51