3

I have some analysis that compares relative velocity shifts between regions. I have a representative sample below (in reality there are more regions -- this is for clarity).

Assume that I have a dataset with 4 regions -- and the possibility of a relative velocity shift between all four. The only method that I have for determining this relative shift involves a process that forces one of the regions to have a shift of "zero" -- and the other values to shift relative to that.

This means that the y-intercept is arbitrary, but the relative y-values between data points is still important. The plot below shows an example of what I'm doing:

two datasets

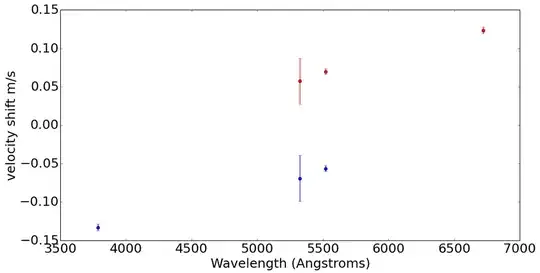
This plot shows the result of finding the relative shifts by alternately setting the first region to zero (red); and the last region to zero (blue). As you can tell, the slope is the same between the two measurements. I also have an error estimate for each point not set to be zero.

I want to fit for the slope across all of the regions.

My question is: is there a statistically robust way to combine this into one fit? Or to fit two linear regressions with independent y-intercepts but tied slopes? Is there another way to think about this entirely?

JBWhitmore
  • 195
  • 1
  • 7
  • For other ways to think about the problem (especially versions with more points in the scatterplot) please see the varied answers to a generalization of this situation at http://stats.stackexchange.com/questions/33078. (In the generalization the information about the colors is lost.) – whuber May 16 '14 at 14:52

1 Answers1

4

This seems like a pretty straightforward application of dummy variables. All you need to do is include an indicator variable that takes the value 1 for red and value 0 for not-red (or vice versa. The coding scheme is arbitrary). As a result, the regression will fit two intercepts, one for red and one for not-red, but the regression will have a common slope for both groups.

So your model will look like this $$\hat{y}=\beta_0 +\beta_{red}d+\beta_{slope}x$$ where $d$ is our indicatory d ummy variable taking 1 for red and 0 for not-red, and $x$ is your independent variable. Because we've coded reds as binary indicators, the intercept for the red group is $\beta_0+\beta_{red}*1=\beta_0+\beta_{red}$, while it's simply $\beta_0+\beta_{red}*0=\beta_0$ for the not-red group.

To extend this to the general case of $k$ different groups, you will need to create $k-1$ dummy variables which are all 0 except for the group membership, which is 1. (We create $k-1$ groups because $k$ total groups would create linearly dependent columns with the column of 1's for the intercept.)

Sycorax
  • 76,417
  • 20
  • 189
  • 313
  • As an aside, if you are using R then you can force the software not to fit an intercept at all. It will still fit the correct number of variables, but each $\beta$ will reflect just the intercept for that dummy coded group (also done automatically by default for factors). For example this fit: `summary(lm(decrease~0+treatment+rowpos,data=OrchardSprays))` produces a separate intercept for each treatment, but a common slope for rowpos. – russellpierce May 16 '14 at 13:14
  • And, for completeness, `summary(lm(decrease~-1+treatment+rowpos,data=OrchardSprays))` does the same thing with a slightly different command. – Sycorax May 16 '14 at 13:15