3

I'm measuring the error produced by operators executing planar cuts under different guiding systems. I define a target plane and then measure the euclidean distance from uniformly sampled points in the target plane to the executed plane. Since the target plane is my coordinate system reference, I define it as the plane $xz$ in $\mathbb{R}^3$. The executed plane $E$ is defined as $ax + by + cz + d=0$ with $b \neq 0$ and, given that I'm sampling points from $xz$ and projecting them into $E$, then $b$ could never be $0$. Then $E$ could be rewriten as $y = -\frac{a}{b}x - -\frac{c}{b}z -\frac{d}{b}$ with $x \sim \mathcal{U}(x_{min}, x_{max})$ and $z \sim \mathcal{U}(z_{min}, z_{max})$. Of course, the cutting tool also produces some (maybe normal) noise that affects $y$. The random variable $y$ is not normally distributed (I've tested it and I've plotted some qq-plots of it).

I have 2 different guiding systems and I have to test if they are significantly different wrt the above described measurement method. Which method do you recommend me to use to test my hypothesis?
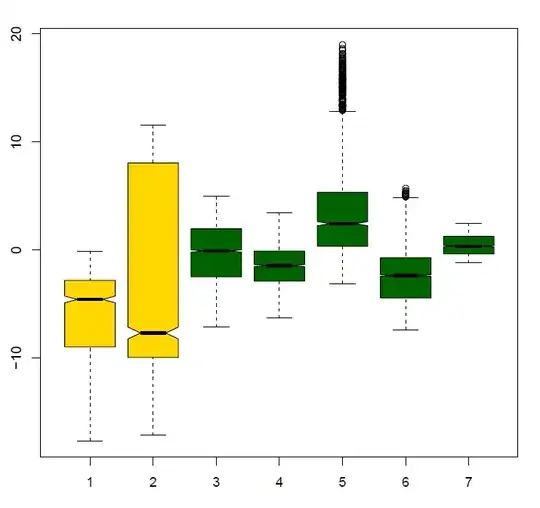
In yellow one of the methods, in green the other one. I'm trying to show that the green method is better

Thanks!

Federico
  • 235
  • 2
  • 8
  • 1
    What hypothesis? – Glen_b May 15 '14 at 19:01
  • @Glen_b Presumably that the executed plane coincides with the target plane. Federico, what can you tell us about the nature of the discrepancy? You have mentioned *measurement error* of the distances, but could you tell us more specifically how the guiding system might fail to miss the target plane? For instance, perhaps it is designed in a way that can create only a translational error (causing the two planes to be parallel) or maybe only a rotational error (guaranteeing the planes will intersect). Perhaps (alternatively) they are constrained to have a fixed intersection? – whuber May 15 '14 at 19:06
  • @whuber but then wouldn't the population value of $b$ be 0? – Glen_b May 15 '14 at 19:08
  • 1
    @whuber actually the options you give (translational error, rotational error, intersection or not) may all appear at the same time (except for a rotation that makes the executed plane perpendicular to xz; in that case b = 0 and the method does not work). This complexity is why we are trying to assess the effectiveness of the guiding system by measuring the error represented by the random variable y. The guiding system is just helping the human operator, that's why we want to know which one has a better effect on the outcome. Thanks! – Federico May 15 '14 at 19:57
  • @Glen_b the hyphotesis that the guiding systems produce different outcomes, in a statistically significant way; then I think we would be able to keep the one with the smallest dispersion and whose expectation is closest to 0 (the result of an ideal guiding system would be one in which y is always zero, that is, plane $E$ is plane xz). Thanks – Federico May 15 '14 at 20:02
  • @Federico Keeping in mind that hypotheses are about population parameters\*, rather than samples, what is the null hypothesis? \*(at least, it should be, if we extend the notion to include the infinite-parametric case to cover things like Kolmogorov-Smirnov tests) – Glen_b May 15 '14 at 23:50
  • @Glen_b The null hypotheses is that, no matter what guiding system we apply, the error is the same. I've been reading a little bit about the Kruskal-Wallis Test. Do you think it may be useful in this case? Thanks – Federico May 16 '14 at 13:21
  • Again, *keeping in mind that hypotheses are generally about population parameters* ... what are we looking for; a difference in mean squared error? Median absolute error? Some tendency for one error to be larger than the other in a more general sense? The Kruskal-Wallis is quite likely to be both useful and relevant but I am trying to find out information that will help guide the choice between that and other alternatives. – Glen_b May 17 '14 at 02:09
  • @Glen_b, I'm looking for two things: a difference in some location parameter (I want to show that this or that guiding system takes you closer to 0 (zero) more often than the others). A difference in some dispersion parameter, maybe variance, since I want to argue that this method is better than the other because you can expect not much variation in its behaviour. In general I want to argue in favor of the accuracy and precision of one system; I don't really know if its better to use the mean or the median and if it is better to use the squared error or the absolute error in this context. – Federico May 19 '14 at 15:12
  • @Glen_b That's a great answer! I've added a boxplot of seven cuts/samples to show you the data I've right now. I want to argue that the green system is better than the yellow one, both in accuracy and precision. If I run a WMW test of the groups formed by both systems, I find a very significative difference. The other issue I find right now is that I would like also to argue that the samples of the green system do not present so much location and dispersion variation between them but running a KW using those 5 samples I also find a significant difference. Please add an answer, I'll choose it. – Federico May 20 '14 at 03:16

1 Answers1

2

You suggest the possibility of a Kruskal-Wallis test, and it's quite possible that it's suitable.

Indeed, the criterion you mention in comments - "closer to zero more often" - directly suggests doing a Kruskal Wallis on the absolute deviation from zero. The two-sample version (a Wilcoxon-Mann-Whitney test) in fact has a direct interpretation in a "smaller more often" sense -- indeed in that case you can scale the U-statistic to an estimate of that probability (by dividing the U statistic by the total number of pairwise comparisons - i.e. its maximum possible value).

If your interest is instead more in some measure of location shift, then with an additional assumption (that the distributions are identical in shape, aside from possible location shift), the Kruskal-Wallis may still be a good choice. Further, in the two-sample case, there's a location-shift estimate that's readily available (one can also obtain acceptance regions - akin to confidence ellipsoids in ANOVA - for the whole set of location-shifts)

Those two possible ways to view the Wilcoxon-Mann-Whitney are discussed in more detail here.

The Kruskal-Wallis is similar, but there's not an exact correspondence because the K-W statistic can be broken up into transitive (WMW-type) and non-transitive differences (See the discussion in item (3) in this answer); usually the second component is relatively small, but sometimes can be important.

Glen_b
  • 257,508
  • 32
  • 553
  • 939