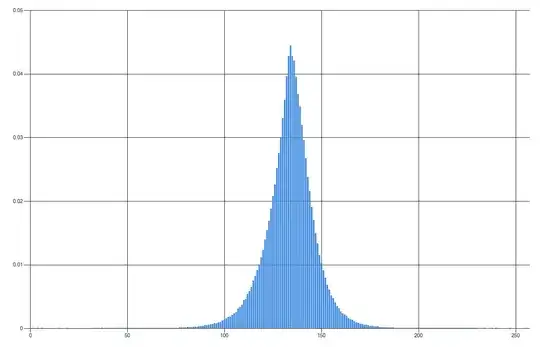
I am doing some signal processing and I have a histogram which has a bell shape when there is only noise in the signal. (I have been advised that this is to be expected due to the central limit theorem)
However when the signal that I am looking for is present
The shape of the histogram changes to
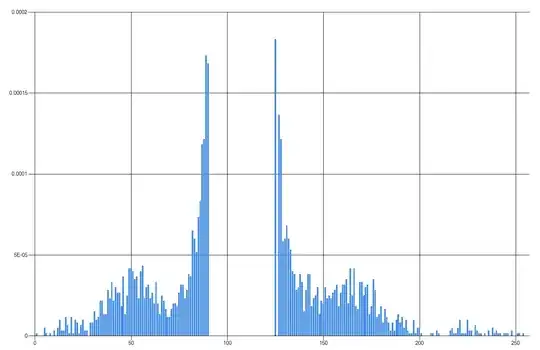
Note that I have removed the bars in the middle because they are so high it makes it hard to see the detail at the base of the curve.
I would like a test to discriminate between these two cases.
I am aware that there are some tests for normality however I am unsure of how appropriate they are in this case as explained here.
One approach that I have considered is testing the smoothness
$\int_{-\infty}^{\infty}{[f''(x)]^2 dx}$
where f is the normal distribution
EDIT
As Glen_b sugested, I tried the Anderson Darling Test
float[] sortedYs;
sortedYs = Hist.OrderBy(a => a).ToArray<float>();
float[] cdf = new float[sortedYs.Length];

MathNet.Numerics.Distributions.LaplaceDistribution ld = new MathNet.Numerics.Distributions.LaplaceDistribution(U, (b));
for (int i = 0; i < sortedYs.Length; i++)
{
    cdf[i] = (float) ld.CumulativeDistribution(sortedYs[i]);
}

float AD = 0;
for (int i = 0; i < cdf.Length; i++)
{
    AD -= (float)((2 * (i + 1) - 1) * (Math.Log(cdf[i]) + Math.Log(1 - cdf[cdf.Length - 1 - i])));
}
AD /= cdf.Length;
AD -= cdf.Length;
AD *= (float)(1 + (0.75 + 2.25 / cdf.Length) / cdf.Length);
(I'm using C# and Math.Net) I'm still not quite sure if this is how anderson darling works. (about 8000 - 14000 for bubbly, about 4000- 12000 for non bubbly). Its also probably worth noting that I have quite a large data set, since my images have 1920*1080 pixels.
The AD value calculated is much higher for moving video frames.
The smoothnes calculation is done by estimating $\int_{-\infty}^{\infty}{[f''(x)]^2 dx}$
using the raw data for f and then by doing the same estimate but using a laplace distribution (using sample mean and b) for f
I find the difference of these two estimates.
I am getting about 0.01 and less for no motion, and higher for moving images. However there is overlap in these categories as well so its not as reliable as I would like yet.
EDIT
I'm going to post some more histograms
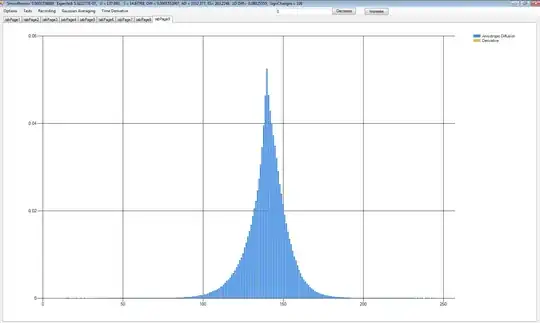
No Motion
Motion Present
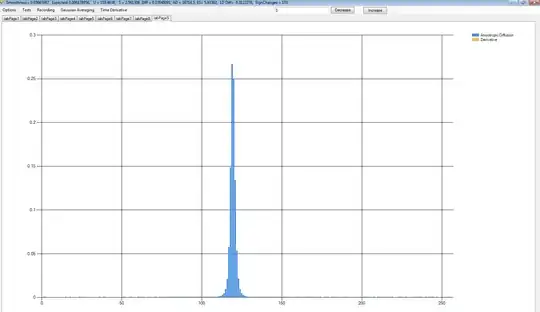
I was looking at the noise in the tails all this time, but if I step back and look at the whole histogram, it can be seen that images with motion have a conspicuously lower variance in their histogram than images without motion.
I think this might be partially due to the way pixels are categorised into bins in a histogram. (I'm using opencv and emgu so I will have to look at the source code for more clues here). Images with motion actually have a wider spread of gray scale values than images with no motion. However when calculating the histogram, the pixels have to be placed in bins from 0 to 255. So an image with widely varying grayscale values has lower resolution bins. And so, more pixels get placed in the same bin, even if they a bit different. This does kind of ruin my data, but at the same time, its an effect that I can take advantage of too.
