I am trying again to explain my problem, and I have more concrete results. I have tried every potentially relevant test I can find, and none seem to work quite right.
The question is illustrated here:

The actual data are protein sequences. I have two categories of specimens, shown by the black and grey circles, and many positions of genes, shown by the colored squares. I want to find which of the gene positions correlate with the specimen categories. For example in row 1, there is perfect correspondence. Nearly all metrics pick up this signal. In row 5, the genes are exactly evenly distributed between the traits, and again most metrics get this. However, in case 4, there is zero predictive power for that trait, (every position has to have one or the other value, so expected value should be 1), but most tests report a high value.
I have a script which calculates metrics for test cases and actual data, and some of these results are illustrated below. The data set has been rotated so the rows are now columns, and the two categories are indicated by the colors of the letters, with two black rows and 4 grey rows.
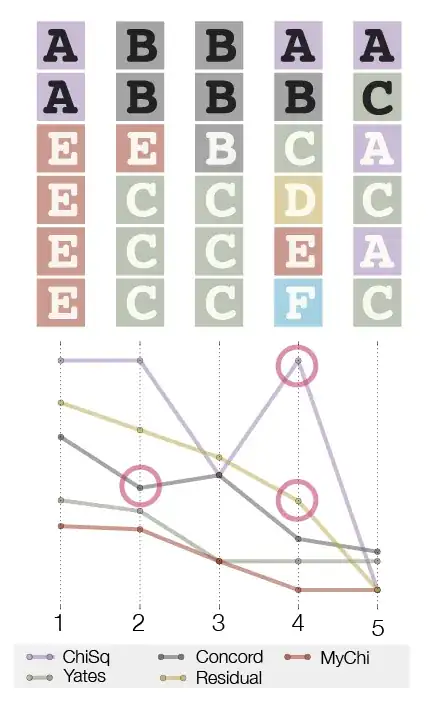
Yates-corrected Chi-square, Mutual Information, Fisher's exact test, Concordance (with some assumptions), etc, all fail on case 4, and some of them give case 2 an equal value to case 1, or score case 3 higher than case 2.
I came up with a metric (MyChi, the rust-colored line above) which is an attempt at a one-tailed Chi-square (only adds values higher than expected, and not lower), normalized by the number of traits present, and not counting the singleton traits. It works pretty well (the columns in the second figure are ordered by how well they "should" score), but I am leery of just making up a test.
The actual data also have a limitation that there will always be lots of zeroes and ones in a contingency table, so many of the standard tests are not recommended. Although there are many rows per sample (and I would like to figure out a way to sum the scores from all rows into one metric), there might only be 20 values for each row.
Does anyone have a recommendation for a test to address this analysis?