According to The SAGE Encyclopedia of Social Science Research Methods…
[a] ceiling effect occurs when a measure possesses a distinct upper limit for potential responses and a large concentration of participants score at or near this limit. Scale attenuation is a methodological problem that occurs whenever variance is restricted in this manner. … For example, a ceiling effect may occur with a measure of attitudes in which a high score indicates a favorable attitude and the highest response fails to capture the most positive evaluation possible. …The best solution to the problem of ceiling effects is pilot testing, which allows the problem to be identified early. If a ceiling effect is found, [and] the outcome measure is task performance, the task can be made more difficult to increase the range of potential responses.1 [emphasis added]
There seems to be lots of advice and questions (and here) dealing with analysing data which show ceiling effects similar to that described in the quote above.
My question may be simple or naive, but how does one actually detect that a ceiling effect is present in the data? More specifically, say a psychometric test is created and is suspected to lead to a ceiling effect (visual examination only) and then the test is revised to produce a greater range of values. How can it be shown that the revised test has removed the ceiling effect from the data it generates? Is there a test which shows that there is a ceiling effect in data set a but no ceiling effect in data set b?
My naive approach would be to just examine the distribution skew and if it's not skewed, conclude that there is no ceiling effect. Is that overly simplistic?
Edit
To add a more concrete example, say I develop an instrument which measures some latent trait x which increases with age but eventually levels off and starts to decline in old age. I make the first version, which has a range of 1—14, do some piloting, and find that it seems there may be a ceiling effect (a great number of responses at or near 14, the maximum.. I conclude this just by looking at the data. But why? Is there any rigorous method of supporting that claim?
Then I revise the measure to have a range of 1—20 and collect more data. I see that the trend more closely matches my expectations, but how do I know that the range of measurement is large enough. Do I need to revise it again? Visually, it seems to be ok, but is there a way of testing it to confirm my suspicions?
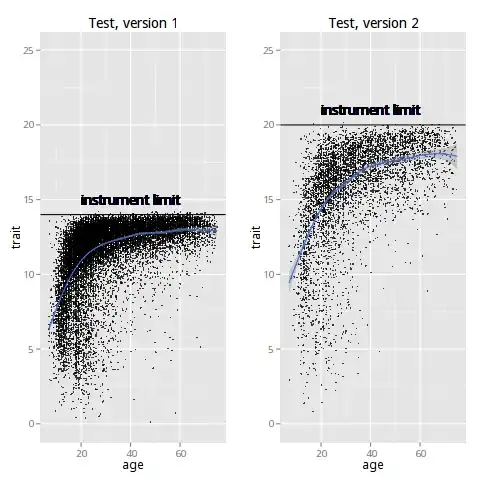
I want to know how I can detect this ceiling effect in in the data rather than just looking at it. The graphs represent actual data, not theoretical. Expanding the range of the instrument created a better data spread, but is it enough? How can I test that?
1 Hessling, R., Traxel, N., & Schmidt, T. (2004). Ceiling Effect. In Michael S. Lewis-Beck, A. Bryman, & Tim Futing Liao (Eds.), The SAGE Encyclopedia of Social Science Research Methods. (p. 107). Thousand Oaks, CA: Sage Publications, Inc. doi: 10.4135/9781412950589.n102