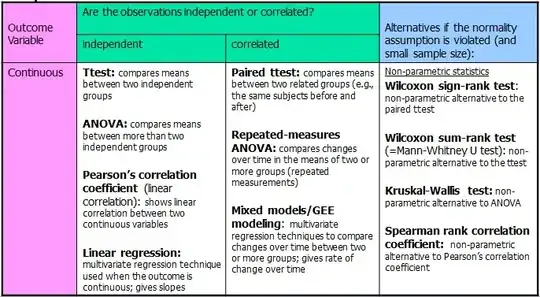
What is normally advised is the mean revenue per user, $\mu$, and the error on that mean, $\sigma_\mu$. Since your samples are large you can likely use the central limit theorem to get the error on the mean as the standard deviation of your samples divided by the square root of the number of users. If you do not trust this you can use bootstapping to get the error on the mean. $\mu$ and $\sigma_\mu$ for each sample gives you enough to build three Gaussian distributions which you can compare using standard methods (eg t-test).
I was unconvinced of this method so I posed this question here Drawing numbered balls from an urn. I phrased it in terms of a classical statistical problem in the hopes of getting a good answer from statisticians. To convert back to business intelligence: ball numbers are price points for products, balls are sales and rounds are users. I am very likely being too rigorous and you are safe to use the method above.
CAUTION: It would be a mistake to calculate $\mu$ or $\sigma_\mu$ using the number of purchasers instead of the number of users who could have purchased. You need to account for the fact that some people did not contribute to the revenue and that this can be different between your splits.
