3

As a part of a design of experiments course I'm taking, I ran an experiment at home. The experiment was checking how water boiling time changes under certain factors (5 overall factors) all which had 2 levels: with or without salt, with or without oil, type of pot, type of water and the diameter of the pot. The experiment was a fractional factorial of [2^(5-1)]*2. I ran the analysis an got this residual plot:

residual by predicted

Residual by row

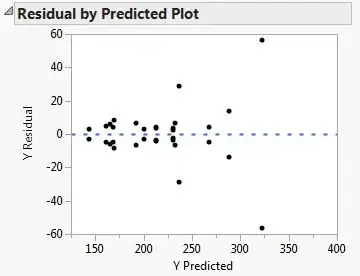
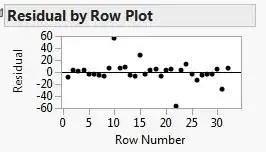
I know it's supposed to be random, but it doesn't seem like it.

A.K
  • 33
  • 4

1 Answers1

2

Plots of your residuals can help you assess whether you have violations of the assumptions of your statistical model. Standard (OLS) linear models assume your errors are independent, all come from the same population, have constant variance, and are normally distributed. (To understand the assumptions behind linear models more fully, it may help you to read this CV thread: What is a complete list of the usual assumptions for linear regression?)

What you are seeing in the top plot is that you have heteroscedasticity. That means you do not have constant variance at all combinations of factor levels. It is showing that the variance grows as the predicted outcome gets larger. This is quite common in the real world. If you assume that you don't have heteroscedasticity, but have a couple of outliers instead, the lower plot helps you identify which data points those possible outliers are.

gung - Reinstate Monica
  • 132,789
  • 81
  • 357
  • 650
  • Does the Y symmetry in the first plot signify anything? Seems like a (errorless) binary factor that's not in the model. – xan May 05 '14 at 23:17
  • @xan, this is a fractional factorial design; ie the DoE the OP ran is that there were only 2 observations per combination of factor levels. Thus all residuals must be symmetric about their mean. – gung - Reinstate Monica May 05 '14 at 23:20
  • Ah, so the expression in the question should be (with parentheses or tex): (2^(5-1))*2 – xan May 06 '14 at 00:27