I guess this is similar to this one but not quite the same. Consider I have a distribution that represents a population (e.g., Uniform(0,1)). I separate this interval (0,1) into three equal parts (0-1/3, 1/3-2/3 and 2/3-1). For the population, I will have for each interval 33.333% of data. The graph for the population is presented below.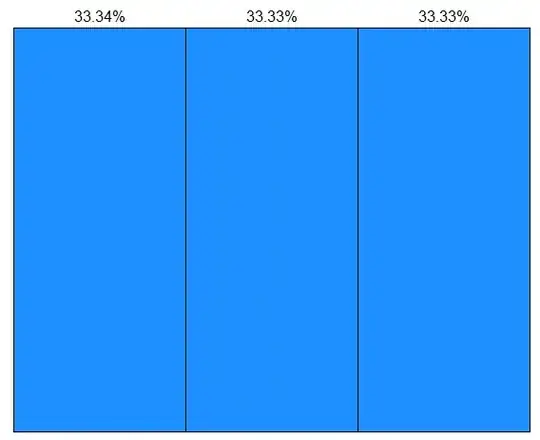
I need samples that represent the populations "well enough". For example, for Uniform(0,1), I could have a sample with 50,000 elements and a graph as presented below. 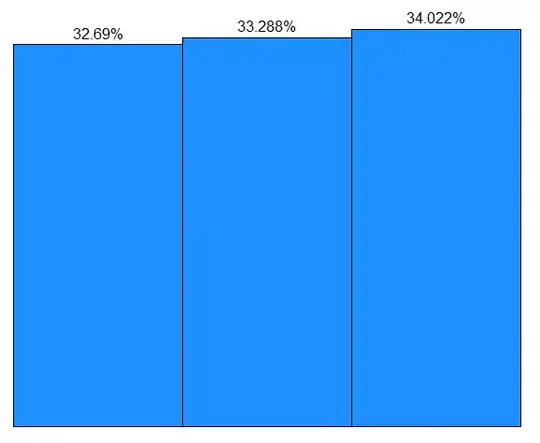
I could get a huge number of samples (e.g., 100000) if performance was not a significant issue, but it is not the case. I am considering that "well enough" is with 4% margin of error and 95% confidence. So, how to calculate the minimum sample size I need to, with a margin of error of 4% and 95% confidence (for each interval), to represent the population (given that the population size is unknown)?
ps.: with "represent the population" I mean having a graph of samples similar to the graph of the population. In other words, for the example and parameters given, with 95% confidence, none of the bars will be below 31.33% or greater than 35.34%