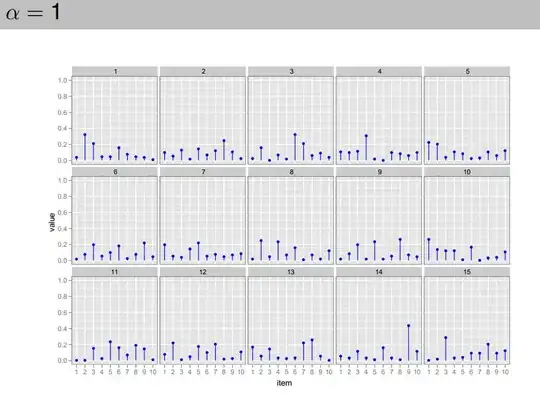
When reading the topic modeling tutorial written by Blei, KDD 2011 tutorial I was confused about a set of diagrams which aim to show the effect of $\alpha$ in Dirichlet distribution.
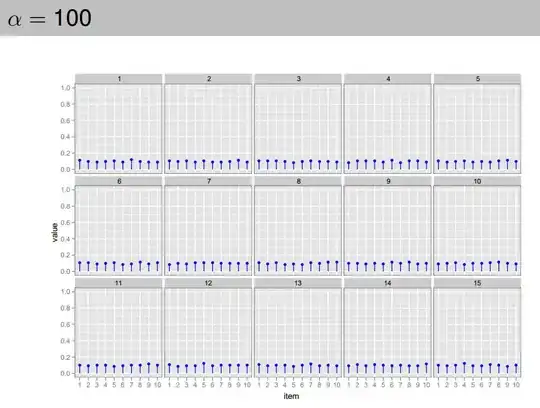
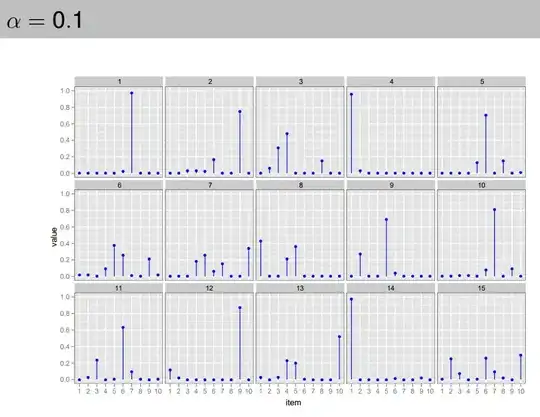
For example, for the plot with $\alpha=1$, what am I suppose to discover? What does item mean here? Do those 15 items mean a 15-dimensional probability vector? The $\alpha=1$ is assumed to lead to a uniform distribution. But I feel confused about how to connect this plot with a uniform distribution. I also list other plots with $\alpha=100$ and $\alpha=0.01$.