3

I have three signals (below) each having the same standard deviation, however, are clearly very different temporally.

enter image description here

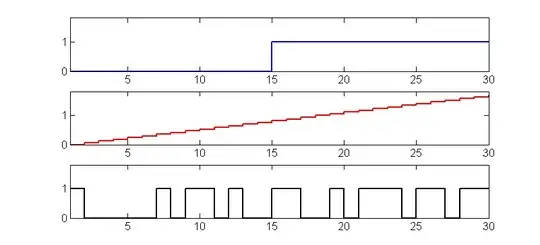
Is there some such metric that could be calculated for each of these signals to give an indication of how they vary over time, such as a measure of continuousness or intermittency if such a metric exists.

If possible, I would like to do this by calculating a single number for each of these signals, rather than windowing into smaller chunks.

Thanks

Stephan Kolassa
  • 95,027
  • 13
  • 197
  • 357
CatsLoveJazz
  • 598
  • 1
  • 4
  • 22

1 Answers1

2

Converting each of your signals to the frequency domain using a frequency domain transform such as the Fast Fourier Transform (FFT) will allow you to distinguish between the three signals shown above as follows:

  • 1st plot is a step function and will show (relatively) high frequency components centred around one peak
  • 2nd plot will show frequency components centred around a (relatively) low frequency peak and will be easily distinguished from the first plot
  • 3rd plot will show multiple peaks in the frequency and could be distinguished by counting the number of distinct peaks in a segment.

If the data shown are the full extent of each signal than putting the data in windows or 'epochs' may not be necessary. Longer signals would ordinarily be examined using a static or sliding window.

BGreene
  • 3,045
  • 4
  • 16
  • 33