I have a question about nonlinear regression and confidence intervals for values estimated from the model. Here is my problem. I have sets of data where $X$ is the logarithm of the dose of a chemical substance and $Y$ is the response readout (normalized to be between 0 and 100%).
I am fitting logistic function to this data using nonlinear regression with 4 parameters:
$$y = A + \frac{B-A}{1+e^{-ax+b}}$$
Once I have estimated the $A, B, a,$ and $b$ parameters, I can estimate the value of $X$ at which $Y$ should take 20%, which is what I need. Everything up to this point is clear.
However, something is unclear to me:
How do I calculate 95% confidence interval for that estimated $X$ value?
I know there is software out there, which can probably do this for me, but I have to understand the principle and algorithm myself, because I have to implement it in my own library.
Any help will be appreciated.
EDIT Dear Eupraxis and Maarten, thank you for your response:
@Eupraxis - Here is the picture, the way I understood your explanation about using function prediction intervals to calculate 95% CI bounds of estimated X value. Is it what you proposed (sorry for hand drawings)?
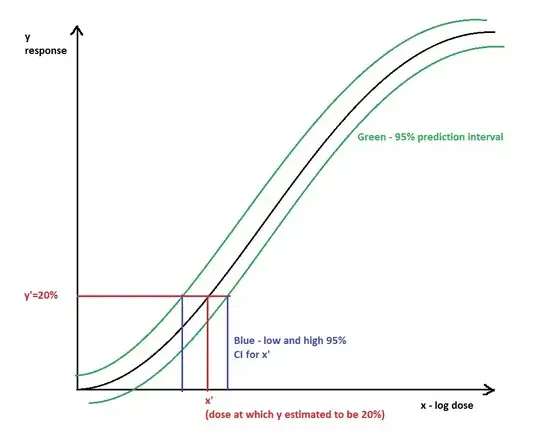
What if my function cannot be re-expressed in linear way? I am not even sure how to do it for logistic curve anyway. Please also see my comment for Maarten.
@Maarten - Thank you for the article! I tried to read it, but frankly it was quite hard to comprehend. I found what it seems to be a much simpler description of delta method for calculation of prediction interval in nonlinear regression:
How to compute prediction bands for non-linear regression?
Then I was planning to use these 95% PI to calculate 95 CI for x' as Eupraxis suggested above. However, there is one thing I do not quite get in this delta method. Specifically, as described:
First, let's define G|x, which is the gradient of the parameters at a particular value of X and using all the best-fit values of the parameters. The result is a vector, with one element per parameter. For each parameter, it is defined as dY/dP, where Y is the Y value of the curve given the particular value of X and all the best-fit parameter values, and P is one of the parameters.)
Could you maybe explain it, perhaps with some numeric example I can follow? The rest of the algorithm seems to be clear to me.