3

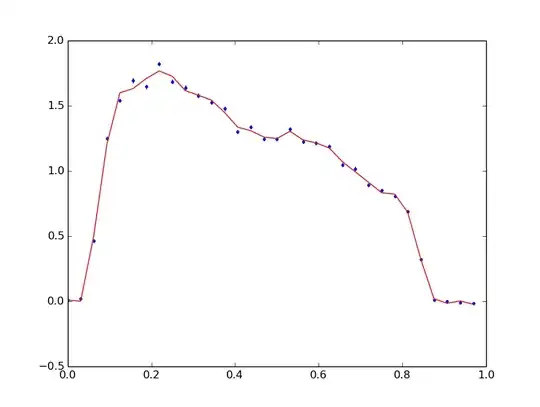
I have a light curve, that is photon count rate versus time, of an astronomical object. These data are periodic since the source signal is periodic. I can fold the data with the period and obtain an average profile.

At this point, I want to check whether the single profiles are statistically different from the averaged one. Then, I was thinking to do a test between the average profile and the single profiles.

This test could be a 2sets KS test, or a Chi-squared test, or others. I don't know which one is better suited for my purpose.

Could you suggest/address me in this, please?

[EDIT]:
Here is a figure where the folded profile is shown in blue points, and the red line a tentative of smoothing the profile (not too relevant for this discussion)

enter image description here

Also, here a small collection of "single-profiles" compared with the model from the red line in the previous figure http: fig1 , fig2 , fgi3.

EDIT 2: here is a cumulative plot (very preliminary).

Benyamin Jafari
  • 217
  • 3
  • 12
Py-ser
  • 403
  • 1
  • 4
  • 11
  • Dependence may be an issue. At the least, you'd want to separate out the single profile from the average of the rest (which could be done by a linear combination of the overall average and the single profile), which would remove one form of dependence (though there might still be some time-dependence issues). – Glen_b Apr 12 '14 at 10:26
  • You mean, every time I want to test a single profile, I should compare it with the average one obtained without including the single I want to test, right? – Py-ser Apr 12 '14 at 10:31
  • Yes, that's what I meant. Is your interest in identifying each one that's significantly different, or just that some are in fact different from others? – Glen_b Apr 12 '14 at 10:58
  • Sorry, I can't understand your last question. You mean: "identify only ONE profile that is different..." ? Could you explain it better? – Py-ser Apr 12 '14 at 11:18
  • I'd have thought that the use of the word 'each' conveyed that I didn't mean 'only one', but 'every individual one'. I was asking about the difference between concluding "at least one is different from at least one other" and "profiles 1, 13 and 28 each differ from the average of all others beside themselves". (Other possibilities exist, such as wanting to identify clusters, so that you might say 'profiles 1,13 and 28 fall into one group and all other profiles form the main group'.) – Glen_b Apr 12 '14 at 13:46
  • Thanks, now it is clearer to me. Looking by eye, it seems to me that there is at least one "class" of profiles that is different from the average one. By "class" I mean that they look like similar each other (they have similar patterns), but still different from the average. However, this is just by eye, so I want to check if they are significantly different from the averaged profile. – Py-ser Apr 13 '14 at 02:14
  • Okay, this is a very interesting problem, but one probably at the margins of my expertise. If you have no good answers within 48 hours of the original post (about 30 hours from now), give me a nudge (@Glen_b me), here or on chat. I may be able to promote the question. – Glen_b Apr 13 '14 at 02:18
  • @Glen_b, if it is still your will, please let's promote this case :) – Py-ser Apr 15 '14 at 01:24
  • Happily (and done). You may encounter some need to further clarify as this goes on. It now has a bonus, which hopefully will get it some attention over the next week. Depending on how things go there's always the possibility of doing it a second time. – Glen_b Apr 15 '14 at 01:53
  • Actually I wish I'd done it two hours ago - I had reputation going down the drain because I hit the 200 point limit yesterday. A bonus would have been the perfect thing to spend the extra on without costing myself anything. – Glen_b Apr 15 '14 at 01:56
  • Thank you. I never promoted a question, I don't really know how it works. Let's see what happens and if it is worthy. Adding more details is good: I myself learn a lot by that. Thanks again. – Py-ser Apr 15 '14 at 02:20
  • Py-ser Once you pass 75 reputation (I think) then after any question has been up 48 hours, a link appears under the comments below the question, but before the first answer (if any), which says 'start a bounty' and has a sort of pinkish background on my monitor. If you click it, you get some choices about how much bounty and which category of bounty to set, and you can add some text if you want. You can play with it up until the point it says something like "are you sure? This cannot be undone", so you can safely go to the "why are you awarding this bounty?" screen, say, and then back out. – Glen_b Apr 15 '14 at 03:34
  • Details [here](http://stats.stackexchange.com/help/bounty). More info [here](http://meta.stackexchange.com/questions/16065/how-does-the-bounty-system-work). Bounties are useful, but you may want to wait until you have a little more reputation before spending it on one. In my case, 50 reputation is no big deal, I can earn it back by answering a couple of questions. If you look at the [featured](http://stats.stackexchange.com/questions?sort=featured) tab on the front page, you'll see your question is on there (near the end); it will climb as the week goes on. I have 2 bonuses running at present. – Glen_b Apr 15 '14 at 03:36
  • @Glen_b, still nothing. Do you think the question is badly posed/not interesting/improvable ? – Py-ser Apr 18 '14 at 02:54
  • The folded profile is an average of many? It might be worth showing the individual ones in a lighter color (perhaps grey), joined by lines, then what you have there over the top. – Glen_b Apr 23 '14 at 03:46
  • It might pay to add more detail and give this a day or two before I try to promote it again. I don't know how I missed the period expiring. – Glen_b Apr 23 '14 at 03:50
  • @Glen_b, thanks. What kind of details could be more useful? Also, the figures are very explicative I hope. – Py-ser Apr 23 '14 at 04:31
  • My earlier comment suggests one way to provide more detail - but for that I'd suggest subtracting the red line and perhaps using transparency so that clusters of individual profiles might be more obvious. – Glen_b Apr 23 '14 at 04:34
  • Sorry I missed the previous comment, but I don't understand your suggestions. The folded profile is the average, yes. What do you mean by "showing the individual ones"? They are showed in the linked figures. Also, what do you mean "clusters of individual profiles"? – Py-ser Apr 23 '14 at 04:44
  • I mean "show them all on one plot". I may be able to mock up something like what I mean, but I can't do it at the moment. – Glen_b Apr 23 '14 at 06:52
  • All of them is not convenient: with such a binning, necessary to understand the profile's features, it would be just a mess. – Py-ser Apr 23 '14 at 10:29
  • I'm afraid I don't follow your comment at all. – Glen_b Apr 23 '14 at 14:09
  • I mean: how can I show all of them in just one plot? There are hundreds of these profiles, If I show them all together you will be not able to recognize anything, any behavior, just some messy points. – Py-ser Apr 24 '14 at 02:09
  • I will mock up an example. But why is the red line at a different height (y value) in the individual profiles than the first image? – Glen_b Apr 25 '14 at 00:31
  • Something like [this](http://i.imgur.com/pKmJlFR.png) is what I had in mind, so that darker grey areas are more suggestive of clusters of profiles. – Glen_b Apr 25 '14 at 01:05
  • Oh I see. Different levels of the red line is due to different normalizations. The one used in the single profiles is the "right" one. – Py-ser Apr 25 '14 at 01:11
  • For my example plot (done in R), I set the color as `col=rgb(170,170,170,30,maxColorValue=255)` which is a medium-light grey set fairly transparent. If you find any single line segments off by themselves, they're quite faint, so it takes several lines to be (nearly) coincident to show up clearly. – Glen_b Apr 25 '14 at 01:37
  • Ok, I edited the original topic to add a new plot. It is not the best, but I think it gives the idea. If this is not the case, please tell me. – Py-ser Apr 25 '14 at 04:37
  • Thanks, that says a bunch. First, not much evidence of a few clear clusters, but there are a few places where there's a number of lines that are close to coincident. That may or may not be just chance - we might need to simulate to see the extent to which that would occur if they were all from one (noisy) population. – Glen_b Apr 25 '14 at 05:49
  • Thank you. So, your suggestion is to go through Monte Carlo simulations? – Py-ser Apr 28 '14 at 08:01
  • Not as an approach to the original question, just on the question "is the appearance of coincident lines in that plot consistent with chance, or does it indicate clustering"... (if you were of a mind to pursue that line of thought.) – Glen_b Apr 28 '14 at 08:15
  • On the original question, I now think a functional data analysis (fda) approach *might* possibly be a useful way to look at the question, but I am not the person for that. – Glen_b Apr 28 '14 at 08:21
  • Ok, never heard about that, I will try to read something about. And many thanks for opening a new bounty! – Py-ser Apr 28 '14 at 08:37
  • The additional image urls are no longer working ... – kjetil b halvorsen Jan 21 '21 at 16:28

3 Answers3

2

At this point, I want to check whether the single profiles are statistically different from the averaged one. Then, I was thinking to do a test between the average profile and the single profiles.

I think which test you should use will be strongly dependent on what the profiles look like, and what you think an "average profile" should even be.

If the periodicity is exact, and the profiles appear to exist in different "classes", then maybe you can apply some sort of clustering algorithm (e.g. k-means) based on a distance metric (Euclidean, treating each profile as a vector -- but if high-dimensional, than maybe Manhattan norm is better?).

Another possibility is to compare some summary statistic applied to the profile, instead of the data directly. For example if the profiles are "similar" visually, but have different phases or magnitudes, then you might want to compute those values as an ordered pair representation that will give more robust results when you start comparing profiles.

Can you post some sample figures or data?

Hao Ye
  • 276
  • 2
  • 8
  • Thanks, I will edit my original post to include a figure. – Py-ser Apr 22 '14 at 01:20
  • Thanks. Q: Is the number of samples (potentially) different for each profile? It looks like fig3 has fewer points than the red "average". – Hao Ye Apr 22 '14 at 18:07
  • Yes, they very often vary in number of points and/or error bars. I have just put 3 profiles to give you an idea of how they are different from the folded one. – Py-ser Apr 23 '14 at 00:32
  • In that case, I would just caution that any distance metric you use for similarity/dissimilarity controls for the number of sample points. (For instance, use RMSE instead of Euclidean distance.) – Hao Ye Apr 25 '14 at 18:54
  • sorry, what do you mean? Are you referring to any particular test? – Py-ser Apr 28 '14 at 08:02
2

If we ignore dependencies between time intervals, then the number of photons received during a specific time frame $[t_i, t_{i+1})$ can be modeled as a poisson distribution $\text{Pois}(\lambda_i)$. Hence, the maximum likelihood estimate of $\lambda_i$ is simply the average count during the time interval $[t_i, t_{i+1})$.

Let us denote the number of time intervals by $n$. A single profile with counts $x_1, \ldots, x_n$ is unlikely if the probability of generating it using the Poisson model with our estimated parameters is low. Since we are modeling the counts using independent Poisson variables, this probability is just the product of the point-mass-function of the different Poisson distributions. $\Pr[x_1, \ldots, x_n | \lambda_1, \ldots, \lambda_n] = \prod_{i=1}^n \frac{\lambda_i^{x_i}}{x_i!}e^{-x_i}$.

To avoid numerical issues, it is probably better to compute the log of this expression. $\log \Pr[x_1, \ldots, x_n | \lambda_1, \ldots, \lambda_n] = \sum_{i=1}^n x_i \log \lambda_i - \log (x_i !) - x_i $.

If this probability is very low then the single profile may be anomalous.

So, how can one choose a bound? The easiest way is by simulation:

  • Simulate many draws from the poisson model. i.e. take $X_i \sim \text{Pois}(\lambda_i)$ for $i=1, \ldots, n$.
  • For each draw $(X_1, \ldots, X_n)$ compute the log-likelihood as described above.

The above procedure yields scores $s_1, \ldots, s_r$, where $r$ is the number of simulations. These scores are samples from the distribution of log-likelihood scores under the null hypothesis. Thus an $\alpha=5\%$ level bound can be estimated by taking the 5-th percentile (from the bottom) of the set of scores $\{s_1, \ldots, s_r\}$.

As Glen_b notes, estimating the $\lambda$ values and then scoring using all the single profiles creates some nasty dependencies. It is better to estimate $\lambda_1, \ldots, \lambda_n$ using all the other profiles except the one currently being tested. However, if the total number of profiles is large, this doesn't really matter.

Amit Moscovich
  • 348
  • 2
  • 5
  • Thank you! Please, could you spend some few more words about "So, how can one choose a bound? The easiest way is to simulate many poisson draws, compute their probability and then take some low percentile of the resulting set of probabilities."? I am not sure about the meaning. – Py-ser Apr 30 '14 at 03:11
  • Don't you think that neglecting the dependency of $\lambda_{i+1}$ from $\lambda_i$ could be a problem? If I follow correctly, you assume here that time intervals are all independent, but we observe here a rise and then a fall in the count of photons. [Py-ser](http://stats.stackexchange.com/users/39611/py-ser), I understand there is no model at all for the photon emissions, am I right? – Zag Apr 30 '14 at 08:55
  • @Py-ser - I've edited for clarity. Can you understand it now? – Amit Moscovich Apr 30 '14 at 14:48
  • @Zad - yes, this assumes independence and I've added a caveat in my answer. This may or may not make sense, but much more details and graphs about the problem domain are needed. – Amit Moscovich Apr 30 '14 at 14:52
  • 1
    @Zag, no, there is no such a model in astronomy, the receiving of photons is considered poissonian. – Py-ser May 02 '14 at 01:14
  • @AmitMoscovichEiger, thanks! It is a very nice answer thank you. However, I never simulated distribution, so I need one last (I hope) clarification: when you say `Simulate many draws from the poisson model`, you mean: take a random value within the poissonian distribution around the data point? Sorry for the terminology, I am trying to keep it simple. – Py-ser May 02 '14 at 01:17
  • Let $\lambda_1, \ldots, \lambda_n$ be the averages of the intervals. One random draw is performed by drawing $X_i$ from $\text{Pois}(\lambda_i)$ for all $i=1, \ldots, n$. You then compute the log-probability of $X_1, \ldots, X_n$ as explained above. Is it clear now? – Amit Moscovich May 02 '14 at 21:35
1

If I understand correctly (and please correct me if I am wrong), we have a stochastic process, that exhibits a well-defined "seasonality" (the orbital phase cycle -OPC). We count photons as the orbital phase evolves (hopefully in the same time intervals and of equal length). Then we chop the process into pieces, each piece of exactly the same length (one full OPC), we "stack" the pieces together, and calculate their average... and we want to test whether each piece (individual profile) is "statistically different" to this average you calculated.

The problem is, we don't know why the OP wants to do that. I am writing this to qualify what will come below -because it may prove useless to the OP.

When we treat a stochastic process like this, then, in order for such averaging calculations to be meaningful, it must be the case that the process exhibits stationarity and/or ergodicity (here in a seasonal/periodic sense, namely, that the process repeats itself stochastically in each OPC). Otherwise, this average profile is meaningless.

So if what I am describing is a correct translation of the case in question, then, testing single sets of process realizations (individual profiles) against the average, is not the way to go. One should test first for stationarity of the process, taking into account its periodic nature.

A simple way to do this is the following: Denote the instances of counts inside OPC $i$ by $C_{1i},C_{2i},...,C_{Ti}$ where $i=1,...,N$. Then take the same count-instance from each OPC and create a time series

$$\{C_{11}, C_{12},...,C_{1N}\},\;\; \text{...,} \;\;\{C_{T1}, C_{T2},...,C_{TN}\}$$

These time series have "by-passed" the periodic nature of the process. If these time series are stationary, then the whole process is seasonally stationary, repeating itself in each OPC.

This approach will also permit to detect perhaps other trends, or temporary phenomena, in your data. Even by visual inspection one could detect shifts or increased variability, and then, if these phenomena happen for the same bunch of $i$'s inside each time series (i.e. for the same OPC's), we will have found a period in the evolution of the process where something has happened, out of the "ordinary".

Assume now we found to our satisfaction that the process is OPC-stationary. Then creating the average profile is meaningful:

$$\{\bar C_{1\cdot}, \bar C_{2\cdot},..., \bar C_{T\cdot}\}$$

Since we have accepted stationarity, this is a series that includes "good approximations" to the expected value of the process in each count instance inside an OPC. Each instance inside an OPC may be governed by a different distribution. The average profile contains estimates of the mean values of these distributions.

Can we now go back to the original question? Can we compare the individual profiles against the average? What we would be comparing here? As said, the average profile is a series of mean values of underlying distributions. Each individual profile is a series containing realizations of these same distributions (per count instance). And we do not test whether a realization of a random variable is "statistically different" from its own expected value, do we?

Let alone the fact that by the look of it, each count instance inside an OPC is not characterized by the same distribution (mean values certainly look different). So a whole OPC cannot be viewed as data coming from the same distribution (it may come from the same family of course). Then, tests that were created to compare two sets of values each coming from a distribution, in order to test whether they come from the same distribution after all, are not relevant here, since each set of values separately does not come from one distribution to begin with. This makes questionable any such comparison between two individual profiles also.

Another answer provided a likelihood approach that is valid in that direction, through the use of a joint distribution of Poissons that permits differences in moments (of course it is valid only if the process is OPC stationary, and so averaging to obtain estimates for the $\lambda_i$s is valid).

But measuring somehow directly the "overall distance" between the average profile and each individual profile, if it tells us something, is how strong was the variability contained in this specific individual profile compared to the average profile. It would not be a "reject/not reject" statistical test of distributional similarity.
Alecos Papadopoulos
  • 52,923
  • 5
  • 131
  • 241