I'm new here, and fairly new to statistics, so I apologize if this is an easy question, but I'm stumped. I'm doing a research project simply for fun (yes, I'm weird like that). I was never able to find a professor at my graduate school interested in sponsoring the study so IRB refused to sign off on it so I was left to conduct it independently. I am somewhat stymied on expressing my finding mathematically and would greatly appreciate any help that you might be able to provide.
My study analyzed 241,000 police records in two neighborhoods over a 17 year span. The crime data was compiled annually and plotted out. The first 12 years of the study one neighborhood had the variable that I was testing in effect, the last 5 years the variable was removed. This allowed me to have a baseline to compare the test neighborhood against.
If the variable did not impact the crime rate, then I would expect to see that the two neighborhoods mirrored each other the entire time, consistently, which definitely happened in some cases. However, in other cases the result was a clear and drastic change between the control period and the test period, as pictured below. 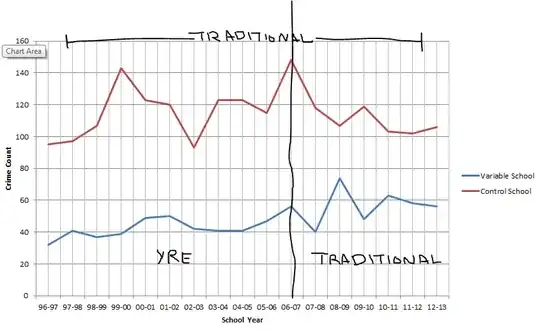
I've tried doing trend line analysis, but I'm not sure how to express that difference mathematically. Another researcher suggested that I look at a t-score analysis, but the problem with that is that the t-scores only examine the mean values for comparison. In the case of this particular result pictured here, the actual mean value didn't change, but the year-to-year variance certainly did.
Can anyone offer some advice on how I can be express this mathematically?