0

I'm aware that the t-test needs 'normally distributed data'.

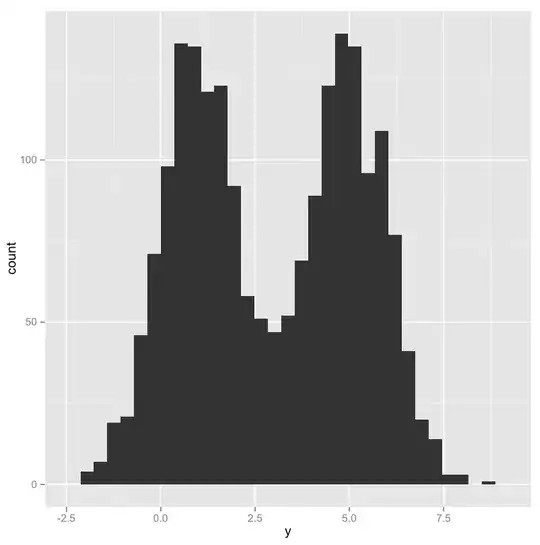
But take the variable y. When it is plotted without being split by group, it isn't normally distributed:

set.seed(1)
y <- c(rnorm(1000, 1), rnorm(1000, 5))
group <- c(rep("A", 1000), rep("B", 1000))
df <- data.frame(y=y, group=group)
library(ggplot2)
ggplot(df, aes(y)) + geom_histogram()

enter image description here

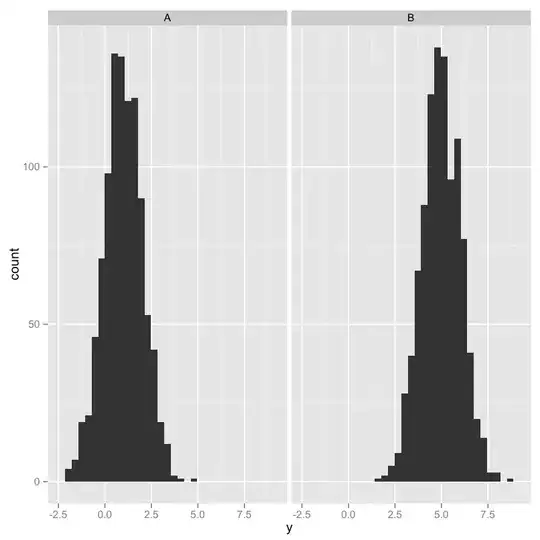
But when y is split by group, it is normally distributed:

ggplot(df, aes(y)) + geom_histogram() + facet_grid(~group)

enter image description here

Can anyone clarify if a variable only needs to be normally distributed after being split by group?

luciano
  • 12,197
  • 30
  • 87
  • 119
  • check [this](http://stats.stackexchange.com/a/30053/603) answer. – user603 Apr 07 '14 at 13:57
  • Scortchi that question doesnt mention anything about distribution of a variable before/after being split by group – luciano Apr 07 '14 at 15:06
  • The t-test is a special case of the linear model (regression). It can also be seen as a special case of the ANOVA. In all cases, it is only the distribution of the residuals that matters. (The residuals of a t-test are the data after having been split by group.) It may help you to read my answer here: [What if residuals are normally distributed, but y is not?](http://stats.stackexchange.com/a/33320/7290) – gung - Reinstate Monica Apr 07 '14 at 15:18

1 Answers1

2

In t-test and ANOVAs, the normality assumption is only required within each unique cell, not for the marginals of the variables. So only the latter plot you showed is the important one. The reason for this assumption in the first place is that since the two tests are from the standard GLM family their respective residuals must be normally distributed, and when only including group means as the predictors this is equivalent to looking at the observed data distributions to see if they are normal.

philchalmers
  • 2,641
  • 1
  • 14
  • 22