3

I originally posted this as an answer elsewhere but in retrospect it seems more like a question: What is the sample-size range for which the median should be preferred to the mean as a measure of central tendency? And why?

I have R code that simulated neuron activity based on the model described at these links: http://www.izhikevich.org/publications/spikes.htm

http://www.izhikevich.org/publications/spikes.pdf

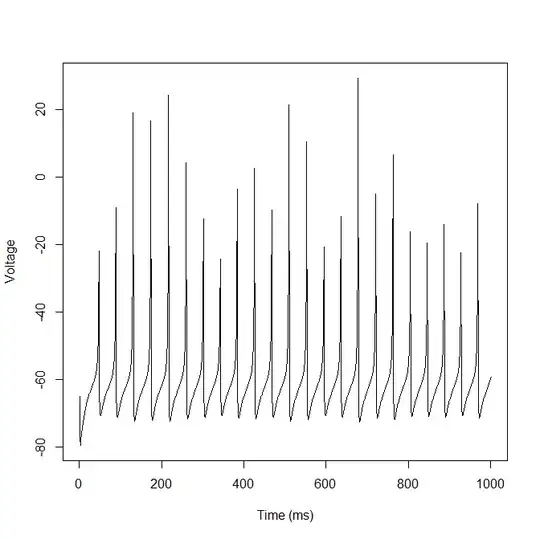
I know how to simulate one but not fit the parameters to existing data. Take this pattern which was generated with the code below. Each neuron could have different a, b, c, d, k1, k2, k3 parameters and also the I parameter (Input Current) could vary over time or be constant for each neuron. The model is described in the pdf above. Anyone know how to fit this model using R? What I would like to be able to do is fit a set of parameters to actual firing data (which would be voltage over time, same as what is simulated).

enter image description here

R code to simulate Neuron:

a=.1; b=.2; c=-65; d=2
k1=.04; k2=5; k3=140
I=4

Ntime=1000
v<-matrix(nrow=Ntime)
u<-matrix(nrow=Ntime)

v[1]=-65
u[1]=0
for(i in 1:Ntime){
  #Fire Neuron if Voltage>30
    if(v[i]>=30){
      v[i]<-c
      u[i]<-u[i]+d
    }

    #Calculate Voltage Change
    dv= k1*v[i]^2 + k2*v[i] + k3 - u[i] + I
    du= a*(b*v[i] -u[i])

    #Update Voltage
    v[i+1]<-v[i]+dv
    u[i+1]<-u[i]+du

}

plot(v, type="l", xlab="Time (ms)", ylab="Voltage")
Livid
  • 1,078
  • 6
  • 15
  • What mode of neuron firing are you trying to fit? Does your experimental data show discrete firing (as the model) or does it display burst firing, trains, etc? –  Apr 01 '14 at 21:05
  • @leonardo I do not actually have experimental data, but I am wondering how to accomplish this. Pretend that the simulated data output by the code provided is the real data. – Livid Apr 01 '14 at 21:10
  • In that case, I was going to suggest trying to divide the parameter space into sections based on the observed firing pattern. One approach may be to get a sense of periodicity from the spikes (cropped above a threshold, say of 30 mV). A simple first approach walking through the parameters may be to minimize the root-mean square error. –  Apr 01 '14 at 21:15
  • @leonardo I am not clear on what you mean by "divide the parameter space into sections" or "walking through the parameters". Minimizing the rmse sounds fine as a goal, but how to achieve it? This seems like it may be a problem good for gradient descent, but I am not sure how I would code it. – Livid Apr 01 '14 at 21:22
  • Dividing parameter space, refering to the top-right panels in the web link, is a way of only checking subsets of parameter values if you knew the mode(s) of firing a priori. Walking through the parameters would be to define a range of each parameter and the running the simulation with incrementally small steps through the range. –  Apr 01 '14 at 22:18
  • This is a naive way of doing it and I don't claim that its efficient, but easiest to comprehend. Gradient descent can also work here but I haven't implemented it. –  Apr 01 '14 at 22:21
  • [This recent article](http://journal.frontiersin.org/Journal/10.3389/neuro.11.002.2010/abstract) should be what you are looking for, by discussing algorithmic fitting of neuron firing models to experimental (or simulated) data. Essentially it describes different fitting algorithms to various models of neuron firing, with Izhikevich's model discussed among the integrate-and-fire models. There is discussion of computation time, computation speed up using GPU and an automated Python package for fitting. It's not R as requested, but should be readily translatable. –  Apr 02 '14 at 02:33

0 Answers0