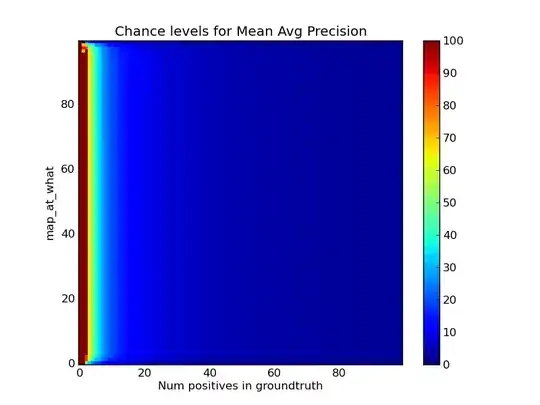
I'm evaluating a multilabel classifier. I'm familiar with the Area Under the Curve statistic, which has some nice properties (e.g. chance level is always 50%). But for some applications, it's more appropriate to use the "Mean average precision" metric which evaluates results based on the top $K$ results returned. MAP is described nicely here at fastml and here at kaggle. In my case I'm using MAP@20, so evaluation is on the top 20 results returned. (My data contains a variable number of true-positive labels for each item, up to 12.)
But: what is a good score for MAP@20? What is a bad score? What is the chance score?
(Clearly 100% is the best score and 0% is the worst.)
I can't find an online reference that discusses this. I think the chance score must depend on the ratio of positive to negative labels in your data.
It would also be helpful to know if there's a useful interpretion of the score. For AUC there's an interpretation as the probability of ranking a random positive instance higher than a random negative instance. Grateful for references or explanations.
