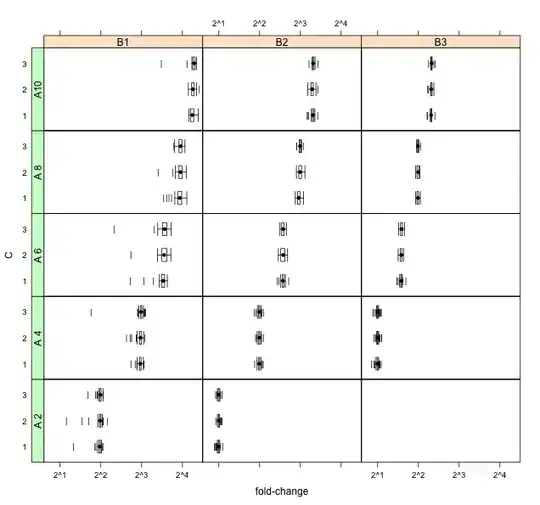
I have a series of left-skewed/heavy tailed distributions that I would like to show. There are 42 distributions across three factors (labeled as A, B and C below). Also, the variation is shrinking across factor B.
The issue I have is that the distributions are hard to differentiate across the scale of the outcome (a ratio or fold-change):
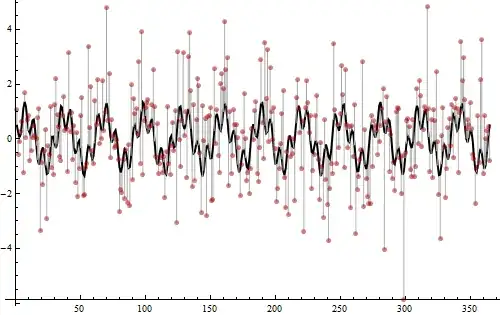
Logging the data seems to over-emphasizes the left skewness and moves more samples into the tails (creating a mash of outlier points):
Does anyone have suggestions on other techniques for visualizing these data?