0

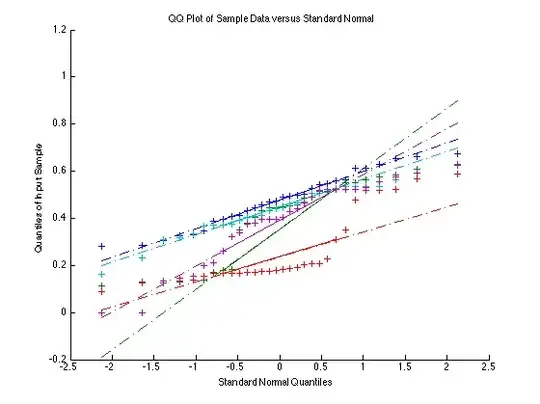
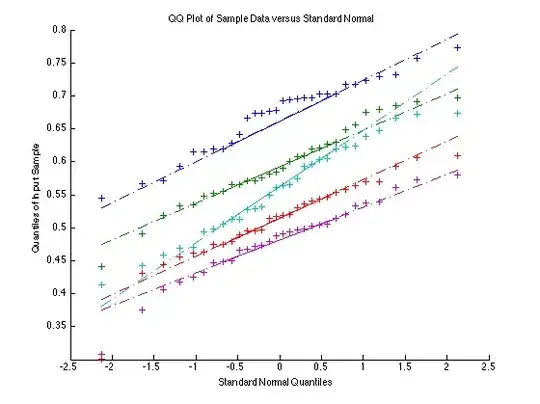
I have four relatively small sets of data under five different conditions. For each set of data I want to see whether the differences between the conditions are statistically significant. The first two sets are by visual inspection (histograms) the least normally distributed, whereas the two latter sets look almost normally distributed, with a few peaks outside what would be the Gaussian function. All data sets fail Kolmogorov-Smirnov and the t-test, but succeed the Chi-square goodness of fit test. The quantile-quantile plot for the first and last set is plotted below, which also suggests almost normal distribution for the better sets (is linear enough, or must it be 45 degrees?):

set1: qqplot1

set 4: qqplot2

The p-values for an ANOVA and Kruskal-Wallis for the four data sets are:

        ANOVA        Kruskal Wallis
set 1   3.21e-07     5.31-05
set 2   1.23e-06     1.04e-04
set 3   3.39e-11     1.18e-16
set 4   1.31e-23     7.20e-17

The outcome of those tests indicate what I found by visual inspection, that the sets are more and more normally distributed from set 1 to set 4. However, in other research and examples I generally see p-values in e.g. ~0.00X. These values are tiny! It seems counter-intuitive given that the data sets failed tests for normality. Is that a reason for concern? Given these results, am I justified in running the ANOVA and plotting confidence intervals, regardless of the fact that the t-test and Kolmogorov-Smirnov test failed? I know that the ANOVA is relatively robust towards non-normal distributions, but is my data too far off?

Edit: Results of t-tests for first and last set as requested:

t-test:
set 1
condition    1         2         3         4         5
H            1         1         1         1         1 
P (1e-09 *)  0.0000    0.0007    0.5115    0.0000    0.0007

set 4
condition    1         2         3         4         5
H            1         1         1         1         1
P (1e-11 *)  0.0000    0.0000    0.0000    0.1729    0.0000
jodles
  • 127
  • 6
  • What are the ANOVAs & Kruskal-Wallis tests here? What are the t-tests of? If you want to test for normality, you would generally do best to use the Shapiro-Wilk test, instead of the KS test, however you might want to consider the ideas discussed here: [Is normality testing 'essentially useless'?](http://stats.stackexchange.com/q/2492/7290) – gung - Reinstate Monica Mar 20 '14 at 15:12
  • The ANOVA & Kruskal-Wallis tests are between a set of 30 samples and 5 conditions (e.g. between 5 columns of 30 samples). Howcome the Shapiro-Wilk test is more appropriate? – jodles Mar 20 '14 at 15:27
  • 2
    Are you trying to test if the means of 5 conditions differ? What were the t-tests? The KS test is less powerful than the SW test & shouldn't be used if you estimated the means & SDs from your data, rather than knew them a-priori. – gung - Reinstate Monica Mar 20 '14 at 15:31
  • Correct, I want to test whether their means differ and whether that difference is statistically significant. Also it would be good to know from the tests whether I am justified in plotting confidence intervals. I've just run Shapiro-Wilk test which succeeded in some of the conditions. I'll put the t-test results above. – jodles Mar 20 '14 at 15:35
  • I find your use of the terms 'succeed' and 'fail' with respect to hypothesis tests confusing to say the least. I don't know which outcome you regard as which, and if anything, generally speaking it's simply a bad idea to treat it that way. – Glen_b Mar 20 '14 at 22:45

0 Answers0