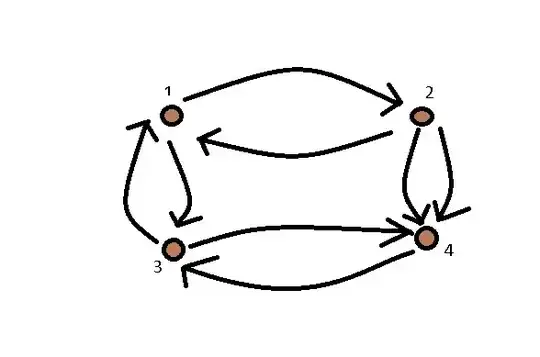
- Why are there negative values in the range of the plot?
- How is the center of the plot (i.e., the $0.0$ point) found?
- How did the black-brown points end up in the third quadrant of the plot?
- Why are red, hazel, & brown positive on the y-axis and negative on the x-axis?
I just really need to learn how to interpret this kind of simple diagram before going further.
This picture was taken from another question on Cross Validated.