10

I'm using the quantreg package to make a regression model using the 99th percentile of my values in a data set. Based on advice from a previous stackoverflow question I asked, I used the following code structure.

mod <- rq(y ~ log(x), data=df, tau=.99)    
pDF <- data.frame(x = seq(1,10000, length=1000) ) 
pDF <- within(pDF, y <- predict(mod, newdata = pDF) )

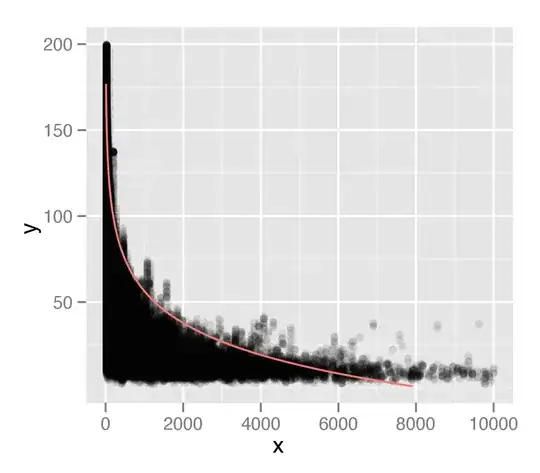
which I show plotted on top of my data. I've plotted this using ggplot2, with an alpha value for the points. I think that the tail of my distribution is not being considered sufficiently in my analysis. Perhaps this is due to the fact that there are individual points, that are being ignored by the percentile type measurement.

One of the comments suggested that

The package vignette includes sections on nonlinear quantile regression and also models with smoothing splines etc.

Based on my previous question I assumed a logarithmic relationship, but I'm not sure if that is correct. I thought I could extract all the points at the 99th percentile interval and then examine them separately, but I'm not sure how to do that, or if that is a good approach. I would appreciate any advice on how to improve identifying this relationship.

enter image description here

celenius
  • 1,324
  • 4
  • 15
  • 26
  • There are a couple of good questions on the site already talking about transforming data like this, see http://stats.stackexchange.com/q/1444/1036 or http://stats.stackexchange.com/q/298/1036 – Andy W Mar 31 '11 at 14:35
  • Can you update the plot to add the conditional median? this seems to me more like a quantile crossing problem than a data transformation problem... – user603 Jul 13 '11 at 17:53
  • @user603 What do you mean by the conditional median? (I searched online but am not sure how to calculate it) – celenius Jul 13 '11 at 18:46
  • tau=0.5 in the rq() function. – user603 Jul 25 '11 at 15:30
  • 1
    If your goal is specifically to estimate the conditional 99th percentile, I'd vote for nonlinear quantile regression (of some sort--I don't know the R packages well), since it doesn't sound like you know the true functional form. I still wasn't clear to me from your previous question what the actual goal is, though, so I would reiterate the comment on your previous question from Spacedman Jan 4 at 17:01 – David M Kaplan Sep 12 '11 at 16:07
  • Why you are fitting `y ~ log(x)` and then plotting it on `y ~ x`? Wouldn't it make more sense to fit `y ~ x`? – momeara Aug 09 '13 at 03:32

1 Answers1

1

All models are wrong, but some are useful (George Box). You are forcing a logrithmic shape to your fitted curve, and honestly it doesn't look that bad. The fit is poor at the tail because there are less points there; the two parameters you have allowed will fit the bulk of the data. In other words, on a log scale, that tail isn't far enough away from the bulk of your data to provide leverage. It doesn't have to do with the quantile nature of the regression; OLS would also disregard those points (especially on the log scale).

It's pretty easy to allow for some more non-linearity. I'm partial to natural splines, but again, all models are wrong:

library(splines)
mod <- rq(y ~ ns(log(x), df=6), data=df, tau=.99)

The quantreg package has some special hooks for monotonic splines if that's of concern to you.

Shea Parkes
  • 3,224
  • 1
  • 16
  • 13