0

try to do linear regressionenter image description hereMy sample is 60 participants. At first, I did not expect to analyze the correlation, but the result is interesting, so I would like to.

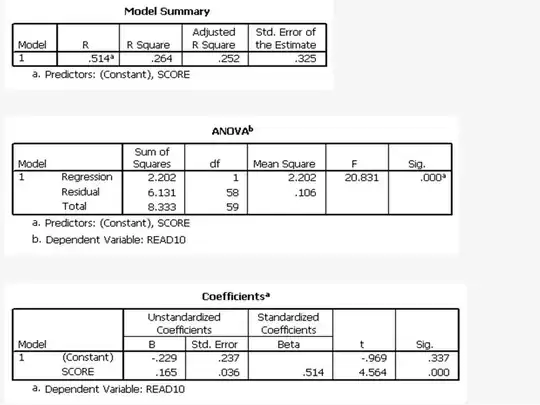
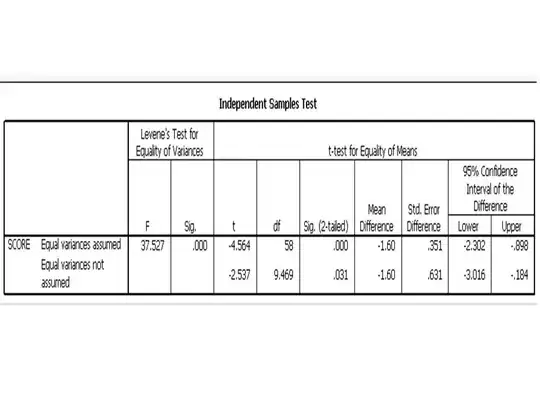
The 60 participants are 50 people who have good reading skill AND another 10 people who have poor reading skill. They took a test for which the full score = 7. The good reading skill group got an average score = 6.7. The poor reading skill group got an average score = 5.1.

Questions: Is there a test to find these relations?

  1. Do the good reading skill group and poor reading skill group have significantly different scores?
  2. Does reading skill relate to achieving score?
  3. Does good reading skill affect score positively?

I have SPSS, but do not know how to analyze these relationships. Thank you.

lek
  • 1
  • 1
  • 2
  • Your one group only has 10 people it, I would be very cautious about drawing conclusions from the dataset. – Akavall Mar 15 '14 at 03:37

3 Answers3

1

Regarding 1 and 2, you can do a t-test; alternatively, if you have covariates to add to the model you could do an ordinal logistic regression.

Regarding 3 there is nothing to do. You can't tell why there is a relationship from the data you have presented.

Peter Flom
  • 94,055
  • 35
  • 143
  • 276
  • I just add the picture to show the result of t-test. Please kindly help me interpret the result. Millions thx. – lek Mar 14 '14 at 22:55
-1

What you should have seen first in the SPSS output is the sig. value from the Levene's test (This is as stated somewhat unclearly but correctly in the 'the usual routine goes'). If sig. value smaller than .05 (stated as 'p < .05'), your data variance is not homogeneous between groups. It being homogenous is (one of the) assumption(s) for parametric tests. This means in your case that you may not use your ANOVA. You will need a Kruskal-Wallis test (because: A) 1 cont. dep var, B) 1 cat. pred var. with 3 levels C) non-parametric) (Or see http://www.thesishulp.com for help, only in Dutch though..)

-1

the usual routine goes:

  • check normality
  • if normality OK, go to parametrics (t-test/ANOVA)
  • if not OK, go to non-parametrics (Mann-Whitney, Kolmogorov-Smirnov, etc)

Update: Since you got a p<0.000 in the Levene, look no further than the 2nd line of the same table. Discard the ANOVA! And run a non-parametric just to be sure..

user41960
  • 1
  • 1
  • 2
    The usual routine is bad. People often check normality inappropriately, misunderstand the K–S test (which I don't think is appropriate here), and misinterpret p values when they only use nonparametric tests after the parametric tests fail. Better to begin with a nonparametric test if you're just going to end up there anyway or aren't overly desperate for specious statistical power. – Nick Stauner Mar 14 '14 at 22:21
  • Actually, I am not sure whether my result is normality or not. How could I know that, please advise. – lek Mar 14 '14 at 23:18
  • Run a Shapiro-Wilk, for each group – user41960 Mar 14 '14 at 23:23
  • The Shapiro–Wilk is another conventional, but bad practice...See [Is normality testing 'essentially useless'?](http://stats.stackexchange.com/q/2492/32036) – Nick Stauner Mar 15 '14 at 00:06
  • 1
    Normality tests are largely useless for large datasets; the OP certainly does not have that problem. However, tests on datasets of size 10 are not very useful either. – Akavall Mar 15 '14 at 03:46