10

I have a histogram of wind speed data which is often represented using a weibull distribution. I would like to calculate the weibull shape and scale factors which give the best fit to the histogram.

I need a numerical solution (as opposed to graphic solutions) because the goal is to determine the weibull form programmatically.

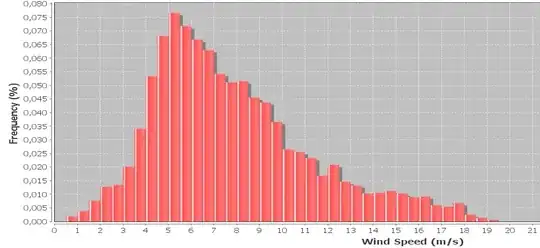
Edit: Samples are collected every 10 minutes, the wind speed is averaged over the 10 minutes. Samples also include the maximum and minimum wind speed recorded during each interval which are ignored at present but I would like to incorporate later. Bin width is 0.5 m/s

Histogram for 1 month of data

whuber
  • 281,159
  • 54
  • 637
  • 1,101
klonq
  • 1,167
  • 2
  • 9
  • 9
  • 1
    when you say you have the histogram - do you mean also have the information about the observations or do you ONLY know the bin width and height? – suncoolsu Mar 30 '11 at 11:10
  • @suncoolsu I have all data points. Datasets ranging from 5,000 to 50,000 records. – klonq Mar 30 '11 at 11:12
  • 2
    What's the purpose of the estimation? To retrospectively characterize past conditions? To predict future power generation at one location? To predict power generation within a grid of turbines? To calibrate a meteorological model? Etc. For this question, determining an appropriate solution depends critically on how it will be used. – whuber Mar 30 '11 at 17:22
  • @whuber at present the idea is to summarise wind data sets in a form allowing comparison from period to period and/or site to site. Later the goal will be compare trends and as you say to form judgements as to future production, etc. I am very much a newbie to stats but I have a mountain of data (which I can't share) and would like to extract as much information from it as possible. If you can point me to any reading on this subject it would be much appreciated. – klonq Mar 31 '11 at 07:02
  • Couldn't you take a random sample of the data and perform a MLE of the parameters? – schenectady Mar 30 '11 at 11:30
  • Did you find out Java Library that does this? if yes, please share. Thank you. –  Dec 09 '15 at 20:17
  • **1**. On the odd occasions I need to estimate a Weibull, I use the parametric survival models in survival analysis (e.g. in R, `survreg` in package `survival`). For fitting a single Weibull, a model like `~1` works (I often have one or more predictors however). $\;$ **2**.if you're collecting data over time, it may not be reasonable to assume independence. At the very least this will impact standard errors of parameter estimates. – Glen_b Dec 09 '15 at 21:26

2 Answers2

12

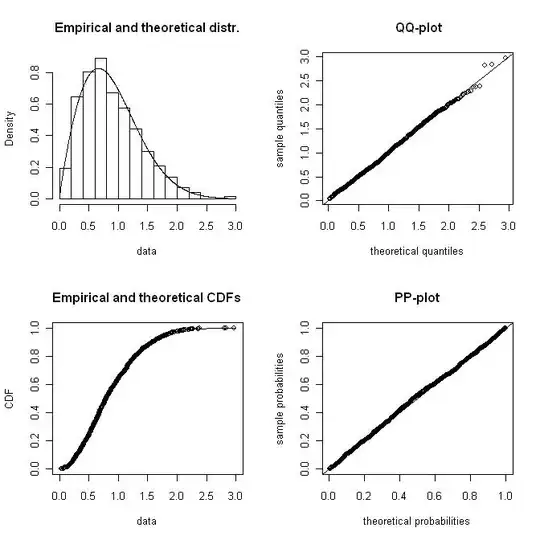
Use fitdistrplus:

Need help identifying a distribution by its histogram

Here's an example of how the Weibull Distribution is fit:

library(fitdistrplus)

#Generate fake data
shape <- 1.9
x <- rweibull(n=1000, shape=shape, scale=1)

#Fit x data with fitdist
fit.w <- fitdist(x, "weibull")
summary(fit.w)
plot(fit.w)


Fitting of the distribution ' weibull ' by maximum likelihood 
Parameters : 
       estimate Std. Error
shape 1.8720133 0.04596699
scale 0.9976703 0.01776794
Loglikelihood:  -636.1181   AIC:  1276.236   BIC:  1286.052 
Correlation matrix:
          shape     scale
shape 1.0000000 0.3166085
scale 0.3166085 1.0000000

enter image description here

bill_080
  • 3,458
  • 1
  • 20
  • 21
11

Maximum Likelihood Estimation of Weibull parameters may be a good idea in your case. A form of Weibull distribution looks like this:

$$(\gamma / \theta) (x)^{\gamma-1}\exp(-x^{\gamma}/\theta)$$

Where $\theta, \gamma > 0$ are parameters. Given observations $X_1, \ldots, X_n$, the log-likelihood function is

$$L(\theta, \gamma)=\displaystyle \sum_{i=1}^{n}\log f(X_i| \theta, \gamma)$$

One "programming based" solution would be optimize this function using constrained optimization. Solving for optimum solution:

$$\frac {\partial \log L} {\partial \gamma} = \frac{n}{\gamma} + \sum_1^n \log x_i - \frac{1}{\theta}\sum_1^nx_i^{\gamma}\log x_i = 0 $$ $$\frac {\partial \log L} {\partial \theta} = -\frac{n}{\theta} + \frac{1}{\theta^2}\sum_1^nx_i^{\gamma}=0$$

On eliminating $\theta$ we get:

$$\Bigg[ \frac {\sum_1^n x_i^{\gamma} \log x_i}{\sum_1^n x_i^{\gamma}} - \frac {1}{\gamma}\Bigg]=\frac{1}{n}\sum_1^n \log x_i$$

Now this can be solved for ML estimate $\hat \gamma$. This can be accomplished with the aid of standard iterative procedures which solve are used to find the solution of equation such as -- Newton-Raphson or other numerical procedures.

Now $\theta$ can be found in terms of $\hat \gamma$ as:

$$\hat \theta = \frac {\sum_1^n x_i^{\hat \gamma}}{n}$$
mpiktas
  • 33,140
  • 5
  • 82
  • 138
suncoolsu
  • 6,202
  • 30
  • 46
  • One thing I would be cautious of is that it sounds like we have time-series data here. If the data are sampled over a short time frame, assuming independence could be hazardous. That said, (+1). – cardinal Mar 30 '11 at 13:09
  • @cardinal Please explain. The data ranges over the course of a month or up to a year, but sampled regularly (10 minutes). What might this imply? – klonq Mar 30 '11 at 13:48
  • @cardinal Thanks for pointing it out. I wasn't sure either if independence assumption is appropriate. – suncoolsu Mar 30 '11 at 13:58
  • 1
    @klonq, how is the sample taken? Is it the average speed over the ten minutes between recordings? Over one minute prior to recording? The instantaneous speed at the time of recording? Mostly I'd be looking for serial correlations, which could reduce your effective sample size considerably. Using an ML estimate based on an assumption of independent samples may or may not still give you a good estimate in that context, and special care should be taken regarding any *inference* based on the estimate. Suncoolsu's approach definitely provides a first line of attack, though. – cardinal Mar 30 '11 at 14:06
  • @klonq -- If possible, can you please describe how was your sample collected? What does the data look like? – suncoolsu Mar 30 '11 at 14:13
  • @cadinal @suncoolsu see edited post. – klonq Mar 30 '11 at 14:23
  • +1 For estimating the distribution parameters, the sample sizes are large enough to overcome @Cardinal's (good) objections. (You do need to account for the serial correlation in deriving standard errors or confidence intervals for the parameters, however.) From the look of the illustration, though, a Weibull is a bad fit. – whuber Mar 30 '11 at 15:28
  • @whuber, I wouldn't call them objections as much as notes of caution. I've also seen and worked with data sets where the effective sample size was reduced by two or three *orders of magnitude* due to dependence structure. Without having any domain knowledge myself for this problem or seeing the raw data, it's hard to know how warranted my notes of caution might be. It is, of course, entirely possible that they could safely be ignored. – cardinal Mar 30 '11 at 16:55
  • @Cardinal Sorry about the mischaracterization; "caution" is much better than "objection." Everybody knows *something* about wind! It varies diurnally and seasonally. If you want an adequate speed distribution for power generation you *must* have a representative sample of both forms of variation. 50K records = 500K minutes = one year definitely captures them both and so will be great to characterize *that year* and perhaps adequate for near-term forecasts *assuming* there is no secular trend or longer cycle (e.g., climate change, sunspot cycles). – whuber Mar 30 '11 at 17:14
  • @Cardinal I should also re-emphasize that effective sample size affects estimates of error, not estimates of the parameters themselves. Of course, estimating the error is of paramount importance for forecasting. We haven't been told the purpose of this distribution estimate, though, so we are left merely to speculate and issue words of caution :-). – whuber Mar 30 '11 at 17:16
  • @whuber, my previous comment was not meant to suggest that I thought you were mischaracterizing. I only meant it as clarification. I also haven't done a good job separating out my comments. I agree that effective sample size is not immediately relevant to the parameter estimates themselves and didn't mean to appear to suggest otherwise. – cardinal Mar 30 '11 at 17:25
  • @whuber, however, the dependence between measurements *does* affect the estimates through the assumptions made on the likelihood. Assuming independence in such a circumstance can result in optimizing the "wrong" function which may have relative maxima farth(er) away from the true value. I have seen some work related to examining such situations. Lindsey is one of the contributors I am aware of and *composite likelihood* is the name of the game. In some cases, using the "wrong" likelihood does not result in a big penalty in terms of estimation efficiency. – cardinal Mar 30 '11 at 17:29
  • @Cardinal It all depends on what you're trying to accomplish. Taking the OP at face value, *if all you want is a parametric characterization of the numbers in your dataset,* then ML will do a great job. If you're going to make inferences, estimates, or predictions--which is a more interesting and valuable exercise, to be sure--then the result will be only as good as your model. In particular, if you don't model strong serial correlation and it's there, watch out! I believe this is what you're saying and I'm agreeing with you. – whuber Mar 30 '11 at 17:40
  • @suncoolsu @cardinal @ whuber thanks for your comments. The mathematical solution by @suncoolsu really makes my head spin. I will have to investigate "standard iterative procedures such as Newton-Raphson" and may require help on this in the future. Much appreciated – klonq Mar 31 '11 at 07:05
  • Should the scale parameter found at the end be raised to the power of the inverse of the shape parameter? – Will Hardy Apr 26 '13 at 19:43