Your description is insufficient basis for identifying the distribution. Several distributions can fit your description (e.g., a truncated normal distribution). Wikipedia defines triangular distributions by further conditions. In your case, if your distribution's mode $=50$, the triangular pdf would be: $PDF= \begin{cases}
0 & \mathrm{for\ } x < 0, \\
\frac{x}{2500} & \mathrm{for\ } 0 \le x \leq 50, \\[4pt]
\frac{100-x}{2500} & \mathrm{for\ } 50 < x \le 100, \\[4pt]
0 & \mathrm{for\ } 100 < x
\end{cases}$
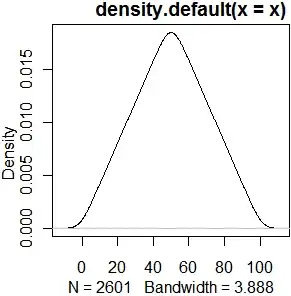
If that's not exactly what your distribution looks like (assuming the mode is exactly 50, which it doesn't need to be; the distribution can be asymmetric around an off-center mode), then it's not exactly triangular. It might be approximately triangular, but then it might also be considered approximately normal. After all, skewness $= 0$ and kurtosis $=-.6$ for an exactly (symmetric) triangular distribution, which isn't too bad. Regarding what's "approximate enough" for your intended purposes, I recommend reading, "Is normality testing 'essentially useless'?" It's a good primer on graphical analysis and interpretation for distribution identification. Another useful point therein: the sensitivity of an analysis to distributional assumptions depends on what analysis we're talking about (and you haven't specified that either).
Technically, if your dataset is a sample, and if you don't know the population's $\mu$ and $\sigma$, you can only calculate $t$-statistics $(\frac{x-\bar X}s)$ where $\bar X$ and $s$ are the sample mean and $SD$, respectively, because $z$-scores are defined in terms of population parameters. But now I'm being more technical than @Glen_b, so you can probably ignore this detail quite safely!