5

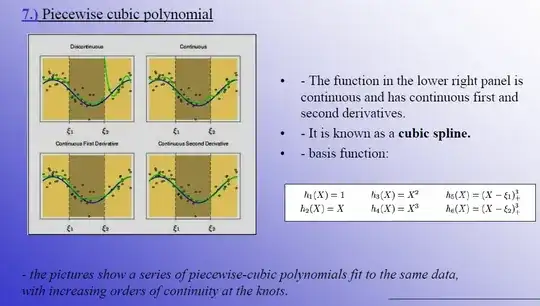
I am trying to wrap my head around splines and the concept of basis functions using the Elements of Statistical Learning. I understand that the goal is to find polynomials that are continuous at first and second derivatives. However, following the picture below, I don't understand whether

  • a) the spline consists of a different cubic function $(a+bx+cx^2+dx^3)$ in each of the three regions, or
  • b) whether the spline is the linear addition of the 6 basis functions per below across the entire domain, or
  • c) whether there are 6 basis functions with different parameters in each of the 3 regions (hence 18 different functions). Much appreciated...
enter image description here

Carl
  • 11,532
  • 7
  • 45
  • 102
user1885116
  • 2,128
  • 3
  • 23
  • 26
  • this seems to belong to a math forum – Aksakal Mar 02 '14 at 21:20
  • 4
    @Aksakal On what basis? (No pun intended). Splines are a useful and widespread tool for nonparametric regression and the example has been taken from a classic statistical text book. – M. Berk Mar 02 '14 at 22:40

1 Answers1

2

This looks like a truncated power basis. The answer is b) although $h_5(X)$ will only be non-zero if $X$ is greater than $\xi_1$ and similarly for $h_6(X)$ and $\xi_2$

M. Berk
  • 2,485
  • 1
  • 13
  • 19
  • 1
    Thanks so much - very welcome. Is there a straightforward manner in R to show the 6 basis functions that would make up a cubic spline? i tried to extract them from the ns command (http://stat.ethz.ch/R-manual/R-patched/library/splines/html/ns.html) - but the output is a 15 by 6 matrix, whereas i would have expected a 6 *4 matrix (6 cubic polynomial basis functions of the a+bx+cx2+dx3 form (4 coeffficients). – user1885116 Mar 03 '14 at 18:09
  • 1
    @user1885116 bear in mind that `ns` produces a different basis to the one shown here as it's a natural B-spline rather than the truncated power basis. As for the dimensions of the output - what is your data, how many knots are you using and where are they placed? – M. Berk Mar 03 '14 at 19:01