4

We have a bivariate normal process where $X \sim N(\mu_x, \sigma), \, Y \sim N(\mu_y, \sigma)$, with no covariance.

$(\mu_x, \mu_y)$ are unknown.

(For convenience we can assert that $\sigma = 1$, or that we have a good estimate for its value.)

We are trying to characterize the distance between our sample center and the true center $(\mu_x, \mu_y)$ as a function of shots sampled n.

Because we don't care about the location of the true center, only our distance from it, we assert that $\mu_x = \mu_y = 0$ and look at the random variable $R(n) = \sqrt{\overline{x_i}^2 + \overline{y_i}^2}$ -- the distance between sample center and true center.

Question: How can we characterize the confidence interval of R(n)?

Note that $R(n) \ge 0$ and $E[R(n)] \to 0$ as $n \to \infty$

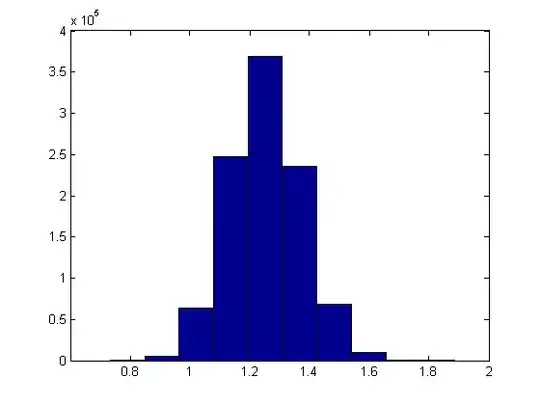
I have Monte Carlo estimates of both the mean and standard deviation of R(n) for small n.

I want to calculate confidence levels and intervals for R(n). I.e., given n and confidence level 90% what is the confidence interval of a sample R(n) about its population mean?

I don't believe this is amenable to CLT analysis because the values are bounded at 0.

I suppose I could Monte Carlo the edf since I'm only interested in $n \in [2, 30]$, and the edf must scale with $\sigma$ or $\sigma^2$. But first I want to make sure I'm not missing something obvious or a known closed-form expression.

feetwet
  • 703
  • 1
  • 7
  • 24
  • 1
    Confidence intervals, by definition, apply to *parameters*. "R(n)" (whatever it might mean) does not appear to be a parameter. Are you perhaps asking for confidence intervals for $\sigma$ (which appears to be the only parameter in the question)? Please edit your question to clarify this point. – whuber Feb 27 '14 at 18:33
  • I thought s/he's trying to figure out what's the distribution of R(n) – Aksakal Feb 27 '14 at 18:57
  • R(n) is the distance from the center estimated by _n_ samples of the bivariate random variables {x, y}. Given _n_ I should be able to say that I have _K_ confidence that R(n) is within _E_ of the origin (which is the true center in this model). Right? – feetwet Feb 27 '14 at 18:58
  • R(n) is a statistic based on your data: it is what it is; one does not compute a confidence interval for it. It sounds like you might be in a situation where $X\sim N(\mu_X,\sigma)$ and $Y\sim N(\mu_Y,\sigma)$ with unknown $\mu_X, \mu_Y,$ and $\sigma$. You seek a confidence region for $(\mu_X,\mu_Y)$ based on $n$ independent observations of $(X,Y)$. But I'm only guessing, and since you're struggling with the terminology it would be much better for you to re-ask your question using your own language. Why not tell us what $X$ and $Y$ really are and explain what you want to learn from them? – whuber Feb 27 '14 at 19:32
  • 1
    We're looking at gunshot impacts on a target, assuming they're distributed as an independent bivariate normal. We want to "sight in" a gun by taking shots to estimate where the center of impact is. It's common to take only 3 "sighting shots" and use the center of those three points as the estimate of the true center. We want to characterize how far that is on average from the true center, and how that distance shrinks as we take more sighting shots. So, we have _n_ shots with an _x_ and _y_ value, and we compute a sample center _C_ from those. R(n) is the distance of _C_ from the origin. – feetwet Feb 27 '14 at 19:53
  • Okay! My previous comment describes your situation, *because you do not know beforehand where the shots will tend to land.* You want to estimate that point (that is, the parameter $(\mu_X,\mu_Y)$) and compare it--relative to the standard error of estimation--to the target's origin at $(0,0).$ This is a crucial point because your confidence region needs to be based on the *normal* distribution of $(X,Y)$ and not on the $\chi$ distribution suggested by @Aksakal. But, once again, I could be misunderstanding... – whuber Feb 27 '14 at 21:10
  • Could you edit your question to reflect this information? Could you also explain how you know *a priori* that the variance in the X and Y directions is the same? – Glen_b Feb 27 '14 at 22:37
  • Just tried to incorporate the clarifications. Willing to keep trying until I've got it right! Regarding the bivariate model: I'm just asserting equal variance and no covariance for this analysis. That does turn out to be a valid model for a lot of real-world cases I've analyzed. And once I nail this I try to expand to the more complicated bivariate forms. – feetwet Feb 28 '14 at 01:22
  • 1
    Just as a wrap up for statisticians: It the following correct? You want to find a confidence interval for the parameter $\theta := \sqrt{\mu_x^2+\mu_y^2}$, where $(\mu_x, \mu_y)$ is the (unknown) center of spherical normal with known $\sigma$? – Michael M Feb 28 '14 at 12:31
  • I believe that's it! – feetwet Feb 28 '14 at 13:32
  • With *great* loss of generality you assume $(\mu_X,\mu_Y)=(0,0)$! Under that assumption there is no need for data or for any confidence interval. It is possible you might be interested in estimating $\sigma$, in which case a confidence interval for it could be useful: that is essentially what @Aksakal's answer does. Please decide, though, what your question really is. According to one of your comments you wish to "estimate where the center of impact is," which is what your first paragraph asks, but the rest of your question casts considerable doubt on that. – whuber Feb 28 '14 at 15:02
  • @whuber, $(\mu_X,\mu_Y)=(0,0)$ doesn't imply that $E[R(n)]=0$, so maybe it's a legit question – Aksakal Feb 28 '14 at 15:13
  • @Aksakal Of course! The issue is *what question is actually being asked.* The current version is a mixture of at least two different questions with some stuff that still makes no sense. It is self-contradictory, too: if, as in the first paragraph, we ask for CIs on the $\mu$s, then it is not the case that $E(R(n))\to 0$ as $n$ grows. – whuber Feb 28 '14 at 15:16
  • Let me try again: We are trying to characterize the distance between our sample center and the true center $(\mu_x, \mu_y)$, as a function of shots sampled _n_. Why can't we assert that wherever it is the true center is called the origin? Then we can compute the sample distance as I defined _R(n)_. Further, if we compute the center of an infinite number of samples the distance from the true center must go to zero. My question is, for some finite _n_, what is the confidence interval about that distance from center? It must shrink and tighten as _n_ increases. Is this clarifying things? – feetwet Feb 28 '14 at 17:59
  • @feetwet, maybe you should re-define your problem like this: $R_i(n)=1/n\sum_{j=1}^n\sqrt{x_{ij}^2+y_{ij}^2}$, where $i$ is the sample. this would be a better definition of an average distance then, $E[R_i(n)]$ – Aksakal Feb 28 '14 at 18:38
  • Just did that and incorporated more clarifications on the above. I believe I have now made it clear that _R(n)_ is a random variable that is a function of _n_. I assume that as a random variable we can talk about its expected value. If we can relate it to an analytic distribution like $\chi$ then we have closed-form expressions for confidence intervals about the mean for any sample of the variable. If we can't then I can only get those from simulation, right? – feetwet Feb 28 '14 at 20:50
  • 1
    Asserting $E[R(n)]$ goes to zero with large $n$ means, *for certain,* that the gun sights are absolutely dead-on accurate. I do not see how you can possibly know that; in fact, it seems to me that is the principal question you are addressing when you conduct this kind of study. Declaring $(\mu_X,\mu_Y)$ to be the origin doesn't work, *because you do not know these coordinates*! You have to use an origin you do know, such as the target center. The two big questions are (1) accuracy: what is $\sqrt{\mu_X^2+\mu_Y^2}$ and (2) precision: what is $\sigma$? *These* are what you need CIs for. – whuber Feb 28 '14 at 20:54
  • Now I see the confusion. I've [separately addressed the estimation of precision](http://ballistipedia.com/index.php?title=Closed_Form_Precision), which is why I stipulate we ignore it here. Now we are just interested in accuracy: I.e., determining how far our point of aim is from the true point of impact. So long as the aiming device is fixed relative to the muzzle we can dial out any detected error. That's why we don't care _where_ the center point of impact is. Given unlimited ammo I'd lock a gun in a machine rest, take a million shots, adjust the sights to that sample center, call it a day. – feetwet Feb 28 '14 at 22:59
  • Since this is a key point let me elaborate: We lock a sight on a gun, note the point of aim, and then try to find the center of the point of impact. **The only error in the sighting-in process is determining the distance from sample center to true center of impact**. That's why we want to know how much error there is and what confidence intervals are for a given number of shots. Once we're satisfied that our estimate of the distance from sample center to true center is small enough we adjust our sights by referencing the original point of aim to that point of impact and we're done sighting-in. – feetwet Feb 28 '14 at 23:17
  • Stepping back from the accouterments of the scenario: If we could take a million independent shots from the same bivariate and compute the sample center we'd be 99%+ certain that distance from the true center (_R(1000000)_) is within some $\epsilon$ of zero. On the other extreme, if $\sigma = 1$ the Rayleigh distribution gives us $R(1) = \sqrt{\pi / 2} \approx 1.25$. _R(n)_ should be strictly decreasing from there because we expect each additional sample point to pull the sample center closer to the true center. – feetwet Mar 01 '14 at 04:44
  • 1
    Possible duplicate of [Distribution of distance from center of sample group](http://stats.stackexchange.com/questions/95873/distribution-of-distance-from-center-of-sample-group) – Felipe G. Nievinski Dec 05 '15 at 15:08
  • @FelipeG.Nievinski - Note that I referenced the answer to that question to inform the accepted answer here. – feetwet Dec 05 '15 at 18:41

2 Answers2

2

Look at $\chi$ distribution, it's a square root of $\chi^2$ distribution, which is in turn a sum of squared normals.

CORRECTION: $R(n)^2=\sum_{i=1}^n x_i+\sum_{i=1}^n y_i = \sum_{i=1}^{2n}z_i$, where $z_i=x_i$ for $i=(1,n)$ and $z_i=y_{i-n}$ for $i=(1+n,2n)$.

Hence, $R(n) = \sigma r(2n)$, where $r(k)\sim \chi(k)$.

$E[r(2n)]=\mu$, where $\mu=\sqrt{2}\Gamma((2n+1)/2)/\Gamma(n)$ The variance $Var[r(2n)]=(2n-\mu^2)$, see $\chi$ distribution. Subsequently, $E[R(n)]=\sigma E[r(2n)]$ and so on.

UPDATE: the CDF is given by the regularized gamma function: $P(n,r(2n)^2/(2))$. To compute the confidence bounds CB you have to solve for CB in $P(2n,CB^2/2)=\alpha$, where $\alpha$ is the confidence, such as 5% or 95%. CB will be in units of $\sigma$. Your math library should have the regularized gamma function, if it doesn't have its inverse then use the solver to find the CBs.

RESTATED problem

I think that it's best to redefine the $R(n)=\frac{1}{n}\sum_{i=1}^n r_i=\frac{1}{n}\sum_{i=1}^n\sqrt{X_i^2+Y_i^2}$. This means that you compute the distance $r_i$ for each pair of $(X_i,Y_i)$ coordinates, then average it acorss $n$ observation to get $R(n)$. Now, it's clear that $r_i^2\sim\chi^2_2$, assuming that X and Y are standardized normals, while $r_i\sim\chi_2$, i.e. chi distribution with 2 degrees of freedom. I gave the links to this distribution, you should be able to work out the math for non-standard normals.

Next, $R(n)$ is the sum of $\chi_2$ distributed numbers, so CLT should be applicable. For n=30 CLT should work great. I would run Monte Carlo then test it with Jarque-Bera or similar tests of normality for smaller n. If it's normal enough, then do the CLT for R(n), while working with closed-forms of $r_i$.

Example: $(\mu_X,\mu_Y)=(0,0)$, $\sigma_X=\sigma_Y=1$, $\sigma_{X,Y}=0$.

$E[R(1)]=E[r_1]=\mu=\sqrt{2}\frac{\Gamma(\frac{2+1}{2})}{\Gamma(1)}=1.2533$

$Var[R(1)]=Var[r_1]=2\cdot 1-\mu^2= 0.4292$

You can test this with the following Matlab/Octave code:

    m=1e6 % number of samples
n=1 % number of X and Y to compute R
mu = 0*ones(2,1); % set ZERO means 
Sig = eye(2); % set unit variance
x = mvnrnd(mu,Sig,m*n)'; % generate X,Y pairs
x = permute(reshape(x,2,n,m),[3,2,1]); % X and Y in 3 dim matrix 

r = sqrt(sum(x.^2,3));
R = mean(r,2); % R(n)
hist(R) % show the histogram
jbtest(R) % test normality

[mean(R) std(R) var(R)]

Which outputs:

ans =

    1.2519    0.6551    0.4291

enter image description here

Now you can run the same for higher n=30, and get the output:

ans =

    1.2534    0.1197    0.0143

Applying the CLT approximation you get $Var[R(30)]_{CLT}=Var[R(1)]/30=0.0143$, very good match, and here's the histogram: enter image description here

Aksakal
  • 55,939
  • 5
  • 90
  • 176
  • That looks plausible: R(n) is distributed like chi(2n) / sqrt(2n). If so are there closed-form confidence intervals for samples of that random variable? – feetwet Feb 27 '14 at 19:24
  • look at the link I gave, it has the CDF as regularized gamma function. I hope it's "closed" enough for you to compute the CIs – Aksakal Feb 27 '14 at 19:30
  • OK, I think I get it. I haven't done closed-form CIs except with Normals, but I assume the method is the same: For confidence level K the confidence interval is given by the inverse CDF between (1-K)/2 and K+(1-K)/2? Is the inverse CDF the same as the Inverse Gamma cdf? Any links I can follow to ensure I don't screw it up? – feetwet Feb 27 '14 at 19:45
  • Just to be clear, isn't it necessary to use k=2n for the chi distribution to reflect the distribution of R(n), and also necessary to multiply the mean by 1/sqrt(k)? – feetwet Feb 27 '14 at 20:07
  • @feetwet, you might be right, I overlooked the bar over x and y in your formula. – Aksakal Feb 27 '14 at 20:29
  • Mathematically this looks plausible. I'm going to Monte Carlo this weekend to try to validate it. – feetwet Feb 28 '14 at 13:39
  • i figured it's more complicated than that, because you're using squares of means, these will not be $\chi^2$, but generalized $\chi^2$ due to cross terms. you're dealing with quadratic forms of normal r.v.s like $X^TX$. I would think about the form of $R(n)$, why is it the sqrt of means? – Aksakal Feb 28 '14 at 13:53
  • Shoot: Are you sure? What you have there now is so elegant! The variable we are analyzing is "distance from sample center to true center. As long as I can define "true center" as the origin -- and why not? I don't care where it is, I only care about my sample distance from it -- then it looks to me like there are no cross terms and $r(k) \sim \chi(k)$ as you showed, right? – feetwet Feb 28 '14 at 18:07
  • $R(n)$ is a multiple of a [non-central $\chi$ distribution](http://en.wikipedia.org/wiki/Noncentral_chi_distribution) with unknown effect-size parameter and $2n$ degrees of freedom. It is a multiple of a $\chi$ distribution only in the very special case that $(\mu_X,\mu_Y)=(0,0)$; that is, when the gun has *already* been sighted in to perfect accuracy. – whuber Feb 28 '14 at 21:55
  • @Aksakal: I don't think it's an average of $\chi(2)$ variables. _R(n)_ is the distance of the sample center of _n_ shots, not the average of the distance of each of _n_ shots. I just restated it in the original question. I was also playing with the $\chi(k)$ model you gave above, which seems correct for the original statement, and something's wrong: I coded the expression you derived for the _E[R(n)]_ as `=EXP(LN(SQRT(2))+GAMMALN((2*N+1)/2)-GAMMALN(N)) / SQRT(2*N)` and it quickly increases from 0.94 towards 1, instead of decreasing with _N_. – feetwet Mar 01 '14 at 04:03
1

As shown by @AlecosPapadopoulos here, $R(n) \sim Rayleigh(\sigma / \sqrt{n})$.

From this we can use the closed-form confidence intervals for Rayleigh estimates.

feetwet
  • 703
  • 1
  • 7
  • 24