7

I am using the heart_scale data from LibSVM. The original data includes 13 features, but I only used 2 of them in order to plot the distributions in a figure. Instead of training the binary classifier, I treated the problem as a one-class SVM by only selecting the data labelled +1.

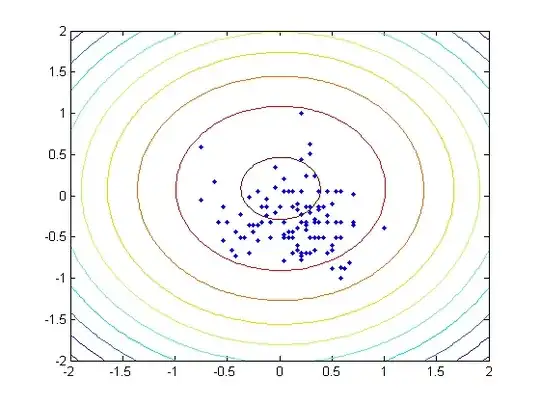
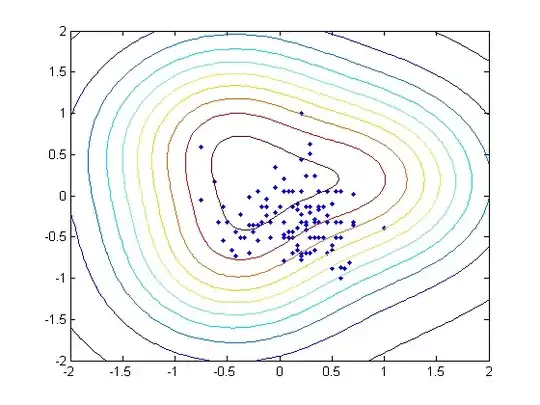
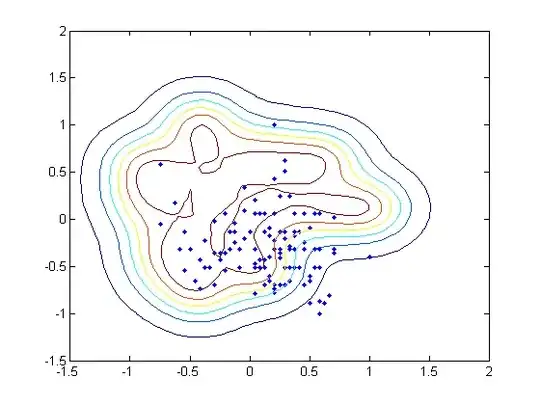
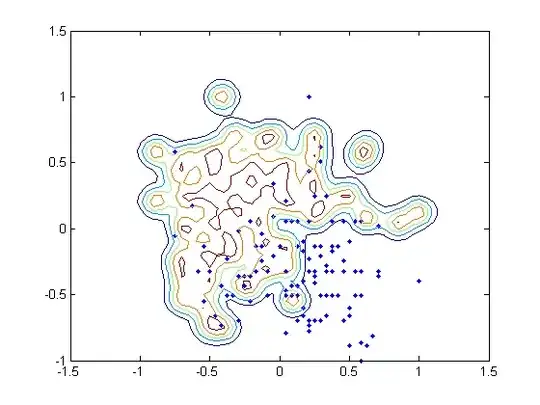
The $\nu$ is fixed to $0.01$ in my case, and I tried 6 different $\gamma$ values for my RBF kernel: $10^{-3}$, $10^{-2}$, $10^{-1}$, $10^{0}$, $10^{1}$, and $10^{2}$. Theoretically small $\gamma$ may lead to high bias and low variance, while large $\gamma$ may get the reverse, and tend to overfitting. However, my result indicates the statement above is only partially true.

  1. As $\gamma$ increases, the number of support vectors are 3, 3, 3, 7, 35, and 89.

  2. On the other hand, however, the training accuracy (the corrected classified data among 120) is 117, 118, 119, 117, 96, and 69. The training error increases dramatically.

  3. I also tried to deal with the binary classifier, and the relation between $C$, $\gamma$ and the variance/bias performance is consistent with the 'theory' trend.

I was trying to understand why this 'contradiction' occurs with one class SVM.

I attached the contour of the 6 different hyperplanes below as well.

lennon310
  • 2,582
  • 2
  • 21
  • 30
  • Not sure I can tell you that much. But let's meet in the chat (not too long though - it's already late here). – cbeleites unhappy with SX Feb 17 '14 at 23:18
  • @cbeleites Thank you very much for your help cbeleites. It's Ok that we can discuss tomorrow. I haven't figured out how to open a chat yet, seems like it is suggested by the system once the conversation thread is too long. – lennon310 Feb 18 '14 at 00:57
  • In order to find out what is going on, maybe it would be good to train the SVM only in the dimensions you depict (i.e. 2 - 3). – cbeleites unhappy with SX Feb 18 '14 at 19:50
  • @cbeleites Hi cbeleites, Just let you know that Prof. Lin added this to their FQA. http://www.csie.ntu.edu.tw/~cjlin/libsvm/faq.html#f425 Thanks – lennon310 Mar 04 '14 at 19:43

3 Answers3

6

Proportion classified correctly is a discontinuous improper scoring rule that is optimized by a bogus model. I would not believe anything that you learn from it.

Frank Harrell
  • 74,029
  • 5
  • 148
  • 322
  • 2
    Could you explain this answer in more detail or provide a reference that explains it? – Underminer Feb 17 '14 at 22:09
  • 1
    Thank you Dr.Harrel. I get your point, but unfortunately the one class svm in libsvm does not support the probability calculation, so I cannot verify the trend of Brier or Logarithmic scoring rule. Is it more likely that applying those two rules will lead to a higher training score in overfitting case? But why the proportion classified correctly is still mostly used in cross validation? Thanks. – lennon310 Feb 17 '14 at 22:36
  • 2
    Proportion classified correctly is still widely used because most practitioners do not understand the property of accuracy scores nor the importance in how one selects a score. If you method does not result in a probability I would suggest turning to a method that does. Among other things you will have the benefit of knowing which cases were too close to call. – Frank Harrell Feb 17 '14 at 23:13
  • @lennon310: you could probably derive a suitable continuous score from the decision function's value which is continuous. – cbeleites unhappy with SX Feb 18 '14 at 19:33
  • 2
    Unfortunately I think that using a proper scoring rule solves only "half" of the problem. SVM are hyperparameters difficult to optimize even if the performance is measured with a proper scoring rule: the obtained solutions jump depending on the particular training set (i.e. exchanging a training sample does not necessarily lead to different SVs, but if they differ, they "jump") nor on the hyperparameters [ Brereton, R. G. & Lloyd, G. R., Analyst, 135, 230-267 (2010). DOI: 10.1039/b918972f]. This is poison for the usual optimization heuristics which assume a continuous target functional. – cbeleites unhappy with SX Feb 18 '14 at 19:38
3

UPDATE

There is probably an numerical error with one class nu-svm in LibSVM. At optimum, some training instances should satisfy w'*x - rho = 0. However, numerically they may be slightly smaller than zero Then they are wrongly counted as training errors. Since nu is an upper bound on the ratio of training points on the wrong side of the hyperplane, numerical issues occur in calculating the first case because some training points satisfying y*(w'*x + b) - rho = 0 become negative.

This issue does not occur for nu-SVC for two-class classification.

The authors added this issue to their FAQ.

-----------OLD ANSWER BELOW-------------------------------------------------------------------------

Thanks for @cbeleites's note. I investigated the influence of both $\gamma$ and $\nu$ in one class SVM. I used 5-fold cross validation (but not the '-v 5' option in libsvm) bu shuffling the data 100 times and then average the accuracy (still use the proportion classified correctly). The result images show the training accuracy, testing accuracy, and generalization error (the difference between the former two) with different combinations of $\gamma$ and $\nu$.

enter image description here

Cbeleites is correct that $\gamma$ itself is not sufficient to determine the variance of the model. The underfitting is very clearly shown in subfigure(3), but it seems like there is only a slightly overfitting around the middle part ($\nu \approx 0.1$, $\gamma \approx 5$, I didn't locate in the exact coordinate). And there is the "longish optimum" as Cbeleites mentioned in the comment. Basically large $\gamma$ and $\nu$ might cause the underfitting but the overfitting dependence on the coefficient is not that evident. I used the logarithm of $\gamma$ and $\nu$ to show the smaller value region more clearly below.

enter image description here

lennon310
  • 2,582
  • 2
  • 21
  • 30
1

Based on Dr. Harrell's suggestion, I tried Logarithmic and Brier scoring rule. Since libsvm does not support probability estimation on nu-svm, I had to do it with binary class SVM.

enter image description here

Some notes on the result image:

  1. The proportion classified correctly is different with the '-b 1' option in training and testing. Since the other scoring rules are calculated with the '-b 1', it makes more sense to compare the last three sub-figures;

  2. The maximal and minimal of the logarithmic and brier are the same ($\gamma$ $\approx 50$), at which the accuracy in sub-figure 2 is $0$, and in sub-figure 2 is $100 \% $. The functions are continuous but not monotone, so my concern in OP still exists.

The figures with only 2 features as it was in the OP:

enter image description here

lennon310
  • 2,582
  • 2
  • 21
  • 30
  • Note that the performance of SVMs usually also depends on the interaction of γ and C. One of @DikranMarsupials papers illustrates that nicely: Cawley, G. C. & Talbot, N. L. C. On Over-fitting in Model Selection and Subsequent Selection Bias in Performance Evaluation, Journal of Machine Learning Research, 11, 2079-2107 (2010). – cbeleites unhappy with SX Feb 18 '14 at 19:45
  • And: ar these training or test set performances? – cbeleites unhappy with SX Feb 18 '14 at 19:46
  • Thank you cbeleites. That may be the reason why my functions are not monotone (underfit->overfit) since I fixed C. I used training data set for prediction (i.e. training performance). – lennon310 Feb 18 '14 at 20:07
  • Training set performance may or may not be monotone depending on the direction of your crossection through the (γ, C) hyperparameter space. I'd expect test set performance to have an optimum in any direction but that optimum to be "longish" (there is often a range of similarly suitable hyperparameter combinations) and slanted against the γ and C axes. – cbeleites unhappy with SX Feb 18 '14 at 20:16
  • 3
    I'm not clear on how a continuous scoring rule can have spikes in the plots. I'd appreciate some thoughts about that. – Frank Harrell Feb 18 '14 at 20:31
  • I think there is some really fundamental problem here. I mean, even is the fraction of correct classifications is not a perfect measure of the performance, how come that the asking for probability estimates completey turns around the dependency on the (unnamed) parameter on the x axis? I suggest you go one step back and work e.g. through libSVM's beginner's guide http://www.csie.ntu.edu.tw/~cjlin/papers/guide/guide.pdf. 1. Reproduce their figures. 2. Redo with the probability estimate. 3. add the log + Brier score. ... – cbeleites unhappy with SX Feb 18 '14 at 23:08
  • ... While accuracy is not a perfect measure, the other 2 should be reasonably in line with the accuracy (the difference is that accuracy is less sensitive and has more variance, but not that it leads to *completely* different conclusions). Importantly, look not only on the performance results, but at the actual models. Plot them. Start with a data set with few feature (astroparticles). – cbeleites unhappy with SX Feb 18 '14 at 23:11
  • side note: you did scale the data as recommended, did you? – cbeleites unhappy with SX Feb 18 '14 at 23:12
  • @cbeleites I used the scaled data set. I think my libsvm code should be correct, and it is probably the method that I calculate the log (quadratic) score is not correct. While the rule curve is continuous on the probability distribution, it may not be continuous on each gamma value. Yet I don't think the conclusions from the two curves are contradicted because the minima of log is consistent with the maxima of the brier. (they are somehow inversion symmetry) – lennon310 Feb 19 '14 at 13:47
  • @cbeleites I suspected my score calculation is not correct because people tend to estimate an probability density based on the given data, and used such a density as the score. But in my case, for each gamma, libsvm only provided a probability of +1 and -1, and p(+1)+p(-1)=1, p(+1)>>p(-1) for each sample labelled +1, verse visa for those labelled -1. I'm not sure whether I should also applied p(+1) for all the training data to fit a probability density curve. How would you do this given the probability values from libsvm? – lennon310 Feb 19 '14 at 13:50
  • @cbeleites the x-axis is gamma by the way, sorry for the confusion – lennon310 Feb 19 '14 at 15:00
  • @cbeleites It seems to me that the decision plane with very small gamma/nu are also dependent with the epsilon (default value is 1e-3). When I changed it to 1e-7, the accuracy curve looks like monotone, although counter-intuitive to the 'theory' that larger gamma and nu tend to overfitting – lennon310 Feb 20 '14 at 14:30