7

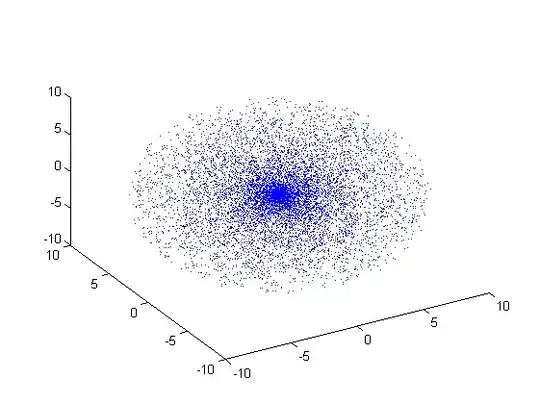
With respect to post (1) and post (2), I generated a large number of uniformly distributed points inside the ball of radius $R$ using $\frac{R_s U^{1/3}}{\sqrt{X_1^2 + X_2^2 + X_3^2}} (X_1, X_2, X_3)$, where $U$ is uniformly distributed between 0 and 1, and $X_1, X_2, X_3$ are independent normal random variables with mean 0 and variance 1. The following figure shows a uniform spherical distribution obtained by this method using 10000 independent draws in a sphere of radius 10. enter image description here

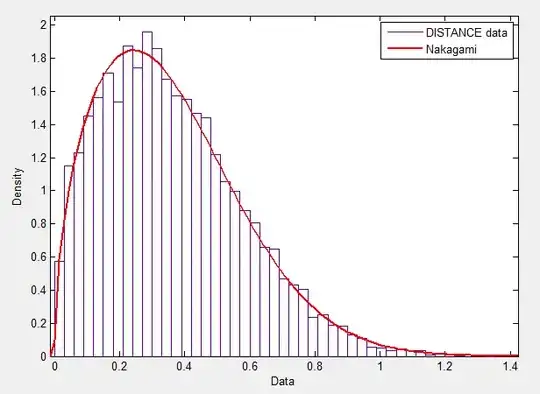
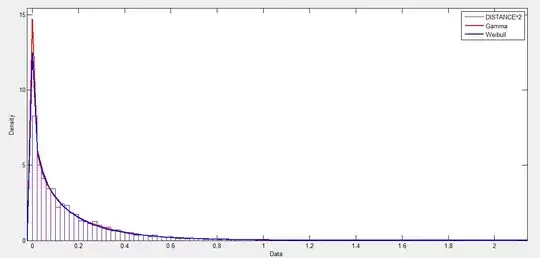
By computing the nearest neighbour distance $d_i$ of every point, I observed that the diagnostic plot of nearest neighbour distances does not follow a uniform distribution. Does this non-uniform distribution mean that one can cluster the points? Does it mean points dont have spatial randomness? If so, then how can I generate random points with uniform nearest neighbour distances.


Temporary images for @Anony-Mousse consideration: enter image description here enter image description here

Jolfaei
  • 141
  • 6
  • 1
    The very picture shows that the distribution is not uniform, it is more dense in the centre. In what sense is it uniform to you? – ttnphns Feb 05 '14 at 12:04
  • @ttnphns yes, you are right. Randomness of $d$ is important for me. I want to avoid point clustering based on nearest neighbor distance metric. – Jolfaei Feb 05 '14 at 12:17
  • If I find the best fit for the empirical distribution of $d$, then I can check the randomness with respect to that distribution. If this test is passed, then can I say that point clustering is infeasible by nearest neighbour metric? – Jolfaei Feb 05 '14 at 12:24
  • 1
    I was speaking not about randomness, but about uniformity. Am I right in that you want a ball of points uniformly populating inside the ball - i.e. like a solid ball of iron? – ttnphns Feb 05 '14 at 12:27
  • @ttnphns I guess you want to make a point. What do you mean by a solid ball of iron? Do you mean homogeneous distribution of points? in that case yes. – Jolfaei Feb 05 '14 at 13:30
  • 1
    In a neat answer to this http://stats.stackexchange.com/q/79919/3277 @RayKoopman showed how to make a n-dimensional ball of points (and any distribution between normal and ball). May that help? – ttnphns Feb 05 '14 at 14:14
  • @ttnphns thank you for your time and your comment. I will read that post carefully. – Jolfaei Feb 05 '14 at 14:17
  • 1
    @ttnphns Those points appear to be correctly generated and distributed. They look more concentrated in the center because the sphere is thicker in the center. – whuber Feb 05 '14 at 22:59
  • Re your edit: please tell us what you mean by "uniform nearest neighbor distances." Would this be a distribution in which each distance within a given range has an equal chance of occurring? Would it be a distribution where all distances are *equal*? Please note that in a CSR process nearest-neighbor distances *cannot* have either of those distributions (that's more or less what your new figures are showing). – whuber Feb 06 '14 at 15:24
  • @whuber Thank you for your comment. That's a good point. I am keen on checking the clustering tendency. In order to be able to answer your question, I need to know how you link each of those 2 definitions for testing the clustering tendency. – Jolfaei Feb 06 '14 at 16:06
  • By "clustering tendency" are you referring to departures from CSR? If so, there are many available tests, beginning with the plots you have shown and extending to more detailed analyses available through the Ripley K function and its relatives: see http://en.wikipedia.org/wiki/Spatial_descriptive_statistics. But it now seems that your question has morphed into something rather different than what you actually wrote here. Perhaps you could edit your post to clarify what you're really after? – whuber Feb 06 '14 at 16:32
  • @whuber sure, I do. Please give me more time to go through the comments first. As you suggested, I might ask a new question. – Jolfaei Feb 06 '14 at 16:42
  • @ttnphns I studied your post regarding "Spherical platykurtic random cloud". I think the solution proposed by RayKoopman may not be applicable for 3D case. It does not create a point cloud with homogeneous density. Increasing α value would disperse points towards the ball surface. For instance, in α = 1, if you calculate the distance of each point form the centre you will notice they are all close to surface. – Jolfaei Feb 14 '14 at 10:13
  • @Jolfaei, Please be kind to copy this your comment to Ray's answer there. Your objection is serious and should be considered at the right place. You might even choose to add your answer to that my question, where you would critisize Ray's solution and/or propose another one. Thank you! – ttnphns Feb 14 '14 at 10:13
  • As for you current question... Why won't you just generate a cube of uniform random points and then cut a ball out of it? – ttnphns Feb 14 '14 at 10:18
  • @ttnphns Yes, you right but unfortunately my reputation is below 50 and I am not able to comment on your post. I have implemented Ray's answer using Matlab and observed the distances from centre are not uniform. I can give you my simulation code and results so that you can ask it in your post. – Jolfaei Feb 14 '14 at 10:21
  • @ttnphns Thank you for your insight. I haven't thought about it. I tried to simplify my problem to get insights from senior experts. Actually, I have a point cloud whose points are (approximately) normally distributed with (mu, sigma). I am looking for a transformation that can hammer it to CSR. – Jolfaei Feb 14 '14 at 10:29
  • @Jolfaei, On the last Ray's pic there is a clear 2D ball with homogeneous inside. Radial (along a radial beam) distribution is uniform. Marginal distribution is of course not uniform. I think the same would be for 3D, 4D, anyD case. I suppose that if you cut a ball out a cube as I've just proposed you'll arrive at the same result as Ray's ball result. Am I not right? – ttnphns Feb 14 '14 at 10:36
  • @ttnphns yes, you are correct, but it is a one-way transformation. One can not do the reverse. I looking for a reversible transformation. Do you have any idea where I should look for it? – Jolfaei Feb 14 '14 at 10:56

2 Answers2

2

I wouldn't expect the distribution of the nearest neighbour distances to be uniform under spatial randomness.

According to Wikipedia (http://en.wikipedia.org/wiki/Complete_spatial_randomness), the distance of the first neighbour in your case has the following distribution:

$P_1(r) = 3\lambda r^2\exp(-\lambda r^3)$

where $\lambda$ is ta density dependent parameter. This is obviously non-uniform!

Concerning your clustering question: You can always cluster points, independently of their distribution.

user1449306
  • 303
  • 1
  • 8
  • How did you calculate the probability distribution function? what is $Lambda$? – Jolfaei Feb 05 '14 at 13:20
  • I think this answer may not be correct. In Complete spatial randomness, the empirical data is assumed to have has Poisson distribution, and randomness is checked with the Poisson theoretical distribution. Also, calculation are done in a 2D space not 3D. This is not my case. – Jolfaei Feb 05 '14 at 13:25
  • I didn'd calculate the distribution, I just adapted the formula of the wikipedia article to your situation. $\lambda$ is connected with the point density and the number of dimensions of your problem. – user1449306 Feb 05 '14 at 13:26
  • Just read the article. The poisson distribution describes the amount of points per region, not the point distribution. – user1449306 Feb 05 '14 at 13:33
  • That formula is for 2D points with Poisson distribution (Refer to Clark-Evans testing procedure). It cant be applied for any other distributions. To test CSR, one need to firstly fit the empirical data to an empirical distribution and then check CSR with respect that. Otherwise, your test results would be wrong. – Jolfaei Feb 05 '14 at 13:38
  • Also, I disagree with your second point. How can you cluster populated points, if they have uniform distribution? – Jolfaei Feb 05 '14 at 13:40
  • In addition to that, assuming homogeneous distribution of Poisson points, the probability distribution function is $f(r)$=$\frac{\rho}{ k}(4 \pi r^2)$ $\exp (-\frac{\rho}{k}$ $(\frac{4}{3} \pi r^3))$, where $\frac{\rho}{ k}$ is the point intensity – Jolfaei Feb 05 '14 at 13:54
  • Look, if you have **uniformly** distributed points, the number of points in a certain area $V$ is Poisson distributed. You're mixing up different things. And clustering depends on the set of rules you apply, why shouldn't it be possible to cluster uniformly distributed points?! – user1449306 Feb 05 '14 at 13:58
  • "if you have uniformly distributed points, the number of points in a certain area V is Poisson distributed." can you explain more? – Jolfaei Feb 05 '14 at 14:10
  • "why shouldn't it be possible to cluster uniformly distributed points?!", We normally use distance metrics to cluster close points. A uniform distribution of distances implies no pattern. – Jolfaei Feb 05 '14 at 14:14
  • Consider a small sphere $S$ inside your ball with uniformly distributed points. The probability to find exactly $k$ points in $S$ is $P(k) = \frac{\delta^k \exp(-\delta)}{k!}$ - the Poisson distribution with $\delta$ depending on volume and point density. – user1449306 Feb 05 '14 at 14:27
  • Concerning clustering: For example, you select some random points as initial clusters and start assigning the nearest neighbours to the clusters. At some point you end up with all points assigned to one cluster ... Actually, I don't understand why you're interested in clustering in the current context. – user1449306 Feb 05 '14 at 14:34
  • You are mentioning that for a uniform distribution of sample points $X$ in a 3D space, the probability that a sample area of a specific size will contain exactly $x$ points can be represented by the Poisson’s exponential function. My question is why? how did you infer the Poisson function? – Jolfaei Feb 05 '14 at 14:37
  • Clustering is a way of unsupervised learning. By clustering, I can make groups of close points and study whether there is some relationship between the points. In a uniform distribution, I cant learn much about points. – Jolfaei Feb 05 '14 at 14:49
  • 1
    Well, you place your points independently of each other with a uniform probability over the ball. Hence you get a constant, position independent density and have met the Poisson-requirements of constant rate (=density) and independence of the events (points). – user1449306 Feb 05 '14 at 14:57
  • Correct. Now, we go back to the first problem. Can I apply the CSR test to any empirical data with a non-uniform distribution? How can I check the uniformity of spherical data? – Jolfaei Feb 05 '14 at 15:08
  • Uh, this is a new question ... If you want to test for uniformity of your points, you can inspect the data visually by using histograms or qq-plots of each dimension. This usually says quite a lot. Or you apply tests like $\chi^2$ or others, but I'm not the right person to help you here ... – user1449306 Feb 05 '14 at 15:22
0

Consider a uniform 1 dimensional $U[0;1]$ distribution.

Probably the simplest distribution we can find, right?

The distribution of distances will not be uniform.

Instead (if I'm not mistaken; might only hold for the central area), it should be a Beta $B(k,n+1-k)$ distribution. If you are talking about the 1 nearest neigbor, that is a $B(1,n)$ distribution. This is only uniform, if $n=1$.

Has QUIT--Anony-Mousse
  • 39,639
  • 7
  • 61
  • 96
  • I have done a test with MATLAB. Using the method explained above I generated 10000 independent points in a sphere of radius 10. I calculated the nearest neighbour distance for all points. Using the curve fitting tool of MATLAB, I found that the best fit for the empirical distribution of nearest neighbours is Nakagami distribution. – Jolfaei Feb 06 '14 at 10:06
  • Knowing that the distribution of nearest neighbour distances is not uniform, then how can I check their randomness? – Jolfaei Feb 06 '14 at 10:12
  • 1
    "Randomness" is a big too vague. You may want to look at the discrepancy of the series, goodness-of-fit tests and Hopkins statistic, for a starter. However, things that appear random to us, may be quite well ordered, see e.g. http://en.wikipedia.org/wiki/Low-discrepancy_sequence for "sub-random" series, that are more evenly distributed than uniform random is... – Has QUIT--Anony-Mousse Feb 06 '14 at 13:07
  • When your sample was Nakagami distributed, than the squared distances should be Gamma distributed, right? Often, you will see your squared distances to be $\chi^2$ or $\Gamma$ distributed. But I don't think this will be well usable for a test. – Has QUIT--Anony-Mousse Feb 06 '14 at 13:08
  • Can you explain more. – Jolfaei Feb 06 '14 at 13:22
  • Can you ask a more precise question? – Has QUIT--Anony-Mousse Feb 06 '14 at 13:47
  • "When your sample was Nakagami distributed, than the squared distances should be Gamma distributed, right?", correct. Please see the temporary images that I added to the question. – Jolfaei Feb 06 '14 at 14:03
  • "...But I don't think this will be well usable for a test", I think you were trying to make a point here. – Jolfaei Feb 06 '14 at 14:10
  • I believe if you add e.g. a 5% or 10% non-uniform but also non-blunt *impurity* into the data - that is actually a lot - it will still look Gamma distributed. At the same time, if you duplicate every data point (think of duplicate submissions!) then the 1NN distribution will be constant 0. But it's the same data, just twice! – Has QUIT--Anony-Mousse Feb 06 '14 at 18:26
  • It obviously isn't mathematically uniform then anymore, but has a very strong structure of having duplicates... nevertheless, for any practical purpose, it is the same data. – Has QUIT--Anony-Mousse Feb 06 '14 at 18:28