10

The recent events in Japan have made me think about the following.

Nuclear Plants are usually designed to limit risk of serious accidents to a 'design basis probability' for example, say, 10E-6/year. This is the criteria for a single plant. However, when there is a population of hundreds of reactors, how do we combine the individual probabilities of a serious accident ? I know I could probably research this myself but having found this site I a sure there is someone that will be able to answer this question quite easily. Thanks

  • 2
    The nuclear situation in Japan is a Black Swan event. According to N.N. Taleb, Black Swan are events of very low probability but have a very high impact. His assertion is that such probabilities are uncomputable, and any computed probabilities have very little bearing on real life. – Gilead Mar 19 '11 at 15:23
  • 1
    http://en.wikipedia.org/wiki/Black_swan_theory – Gilead Mar 19 '11 at 15:30
  • 2
    Taleb, [ *cringe* ]. – cardinal Mar 19 '11 at 15:30
  • 1
    @cardinal, one often wishes the conveyor of such ideas wasn't a guy like Taleb (whose personality can be overbearing). But I wouldn't dismiss the ideas because of the man. – Gilead Mar 19 '11 at 15:37
  • 1
    I've read each of his books. Though interesting, I'd say, few, if any, ideas are *his*. He's been quite successful at popularizing them, though. I've also read a bit of the literature that he cites. Some of it I feel he misrepresents for his own purposes. That perturbs me. – cardinal Mar 19 '11 at 15:47
  • 1
    @cardinal, no disagreements there. I don't think his ideas are truly original, but they have been associated with him due to the popularity of his books. Nevertheless, as someone who does quantitative modeling and straddles the divide between the deterministic and stochastic, I cannot help but agree with many of his observations. – Gilead Mar 19 '11 at 15:50
  • @Gilead...seems that we are getting a bit philosophical here...are you suggesting that there are certain numerical limits to the validity of probability calculations. If so....what is the numerical value at which we say....sorry...that's too low –  Mar 20 '11 at 00:11
  • @Presley, to my understanding, the notion of low probabilities goes beyond numbers -- it's a notion related to epistemology and what is knowable. Exact thresholds cannot be defined because low probability events in a complex system cannot be modeled reliably. For instance, in "beyond design basis" accidents, there is often very difficult to know or predict the probabilities because the no. of past samples could well be very low or none. Therefore to use a numerical probability (e.g. 1 in 1e6) as a metric for risk becomes meaningless, in my opinion. – Gilead Mar 20 '11 at 00:45
  • Again forgive me for quoting the man, but this is what he calls the Fourth Quadrant. He gave a talk to the American Statistical Association about this, and when he's not being controversial, you can sort of pick out some useful ideas from what he's saying. See here for more information: http://stats.stackexchange.com/questions/2906/what-is-the-communitys-take-on-the-fourth-quadrant – Gilead Mar 20 '11 at 00:47
  • Anecdote:where I work, one of our lab managers (an older guy) tells us in our annual safety training: "if an experienced guy who's been at the job 30 years tells you he pipettes with his mouth and nothing's ever happened to him in 30 years, disregard his advice. With safety, past experience is not predictive of future outcome. Humans are notoriously bad at predicting low-probability events. What's worse is that these days, due to modern engineering controls, lab accidents happen so rarely we tend to downplay their probabilities."... – Gilead Mar 20 '11 at 01:17
  • ... so instead of estimating probabilities, our labs try to set loss limits and add robustness to system, e.g. instead of benzene (a controlled substance), toluene is used a sub (less carcinogenic). You can't inhale what you don't work with. Granted, adding robustness isn't always easy or possible (or even economically viable), so it's not a general solution. Nevertheless, I feel that it is important to be aware of the existence of low probability high impact events in our design thinking and build robustness toward the negative ones. – Gilead Mar 20 '11 at 01:27
  • @Gilead...everything you say has merit. However, you mention the term 'less carcinogenic'. This , in itself, is based on probabilistic analysis of low probability values. An overall rationale for building anything, be it a bridge, highway or dam or what have you needs a rational basis. Generally, probability has come into that rationale somewhere along the line. –  Mar 20 '11 at 04:35
  • I apologize for my error: toluene is not less carcinogenic, it is actually not classified as carcinogenic at all. I agree that probability has to come in somewhere (after all, one can't design for every possibility). My only concern is that by assigning an actual number to that probability (a reductionist approach), an incorrect idea of the actual risk is implicitly conveyed. That is all. – Gilead Mar 20 '11 at 16:31
  • 1
    @Gilead I did not know about Taleb but I read a book by Jean Pierre Dupuy in 2004 http://fr.wikipedia.org/wiki/Jean-Pierre_Dupuy, the book is called "Pour un catastrophisme éclairé" and if I reamember, it talks exactly about that. Jean Pierre Dupuy is Teaching at Stanford and at Polytechnic but if I think he mentionned Ivan Illich while talking about that. Does Taleb mentionned sources of inspirations? – robin girard Mar 20 '11 at 19:51
  • @robin, I don't think Dupuy was referenced, but his work sounds interesting. Benoit Mandelbrot's work however was mentioned as a source of inspiration. – Gilead Mar 22 '11 at 01:56

4 Answers4

4

Before you set up your analysis, keep in mind the reality of what the current situation involves.

This meltdown was not directly caused by the earthquake or the tsunami. It was because of a lack of back-up power. If they had enough back-up power, regardless of the earthquake/tsunami, they could have kept the cooling water running, and none of the meltdowns would have happened. The plant would probably be back up and running by now.

Japan, for whatever reason, has two electrical frequencies (50 Hz and 60 Hz). And, you can't run a 50 Hz motor at 60 Hz or vice versa. So, whatever frequency the plant was using/providing is the frequency they need to power up. "U.S. type" equipment runs at 60 Hz and "European type" equipment runs at 50 Hz, so in providing an alternative power source, keep that in mind.

Next, that plant is in a fairly remote mountainous area. To supply external power requires a LONG power line from another area (requiring days/weeks to build) or large gasoline/diesel driven generators. Those generators are heavy enough that flying them in with a helicopter is not an option. Trucking them in may also be a problem due to the roads being blocked from the earthquake/tsunami. Bringing them in by ship is an option, but it also takes days/weeks.

The bottom line is, the risk analysis for this plant comes down to a lack of SEVERAL (not just one or two) layers of back-ups. And, because this reactor is an "active design", which means it requires power to stay safe, those layers are not a luxury, they're required.

This is an old plant. A new plant would not be designed this way.

Edit (03/19/2011) ==============================================

J Presley: To answer your question requires a short explanation of terms.

As I said in my comment, to me, this is a matter of "when", not "if", and as a crude model, I suggested the Poisson Distribution/Process. The Poisson Process is a series of events that happen at an average rate over time (or space, or some other measure). These events are independent of each other and random (no patterns). The events happen one at a time (2 or more events don't happen at the exact same time). It is basically a binomial situation ("event" or "no event") where the probability that the event will happen is relatively small. Here are some links:

http://en.wikipedia.org/wiki/Poisson_process

http://en.wikipedia.org/wiki/Poisson_distribution

Next, the data. Here's a list of nuclear accidents since 1952 with the INES Level:

http://en.wikipedia.org/wiki/Nuclear_and_radiation_accidents

I count 19 accidents, 9 state an INES Level. For those without an INES level, all I can do is assume the level is below Level 1, so I'll assign them Level 0.

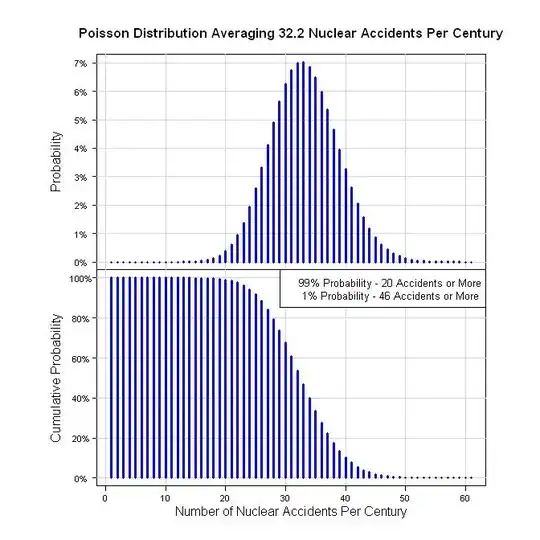
So, one way to quantify this is 19 accidents in 59 years (59 = 2011 -1952). That's 19/59 = 0.322 acc/yr. In terms of a century, that's 32.2 accidents per 100 years. Assuming a Poisson Process gives the following graphs.

enter image description here

Originally, I suggested a Lognormal, Gamma, or Exponential Distribution for the severity of the accidents. However, since the INES Levels are given as discrete values, the distribution would need to be discrete. I would suggest either the Geometric or Negative Binomial Distribution. Here are their descriptions:

http://en.wikipedia.org/wiki/Negative_binomial_distribution

http://en.wikipedia.org/wiki/Geometric_distribution

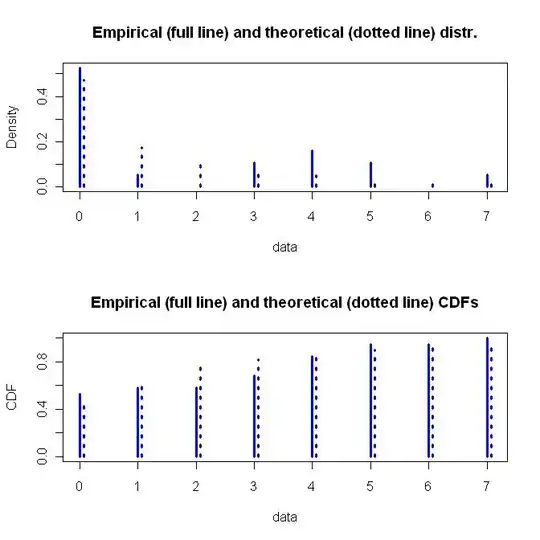
They both fit the data about the same, which is not very well (lots of Level 0's, one Level 1, zero Level 2's, etc).

 Fit for Negative Binomial Distribution

 Fitting of the distribution ' nbinom ' by maximum likelihood 
 Parameters : 
      estimate Std. Error
 size 0.460949  0.2583457
 mu   1.894553  0.7137625
 Loglikelihood:  -34.57827   AIC:  73.15655   BIC:  75.04543 
 Correlation matrix:
              size           mu
 size 1.0000000000 0.0001159958 
 mu   0.0001159958 1.0000000000

 #====================
 Fit for Geometric Distribution

 Fitting of the distribution ' geom ' by maximum likelihood 
 Parameters : 
       estimate Std. Error
 prob 0.3454545  0.0641182
 Loglikelihood:  -35.4523   AIC:  72.9046   BIC:  73.84904 

The Geometric Distribution is a simple one parameter function while the Negative Binomial Distribution is a more flexible two parameter function. I would go for the flexibility, plus the underlying assumptions of how the Negative Binomial Distribution was derived. Below is a graph of the fitted Negative Binomial Distribution.

enter image description here

Below is the code for all this stuff. If anyone finds a problem with my assumptions or coding, don't be afraid to point it out. I checked through the results, but I didn't have enough time to really chew on this.

 library(fitdistrplus)

 #Generate the data for the Poisson plots
 x <- dpois(0:60, 32.2)
 y <- ppois(0:60, 32.2, lower.tail = FALSE)

 #Cram the Poisson Graphs into one plot
 par(pty="m", plt=c(0.1, 1, 0, 1), omd=c(0.1,0.9,0.1,0.9))
 par(mfrow = c(2, 1))

 #Plot the Probability Graph
 plot(x, type="n", main="", xlab="", ylab="", xaxt="n", yaxt="n")
 mtext(side=3, line=1, "Poisson Distribution Averaging 32.2 Nuclear Accidents Per Century", cex=1.1, font=2)
 xaxisdat <- seq(0, 60, 10)
 pardat <- par()
 yaxisdat <- seq(pardat$yaxp[1], pardat$yaxp[2], (pardat$yaxp[2]-pardat$yaxp[1])/pardat$yaxp[3])
 axis(2, at=yaxisdat, labels=paste(100*yaxisdat, "%", sep=""), las=2, padj=0.5, cex.axis=0.7, hadj=0.5, tcl=-0.3)
 mtext("Probability", 2, line=2.3)
 abline(h=yaxisdat, col="lightgray")
 abline(v=xaxisdat, col="lightgray")
 lines(x, type="h", lwd=3, col="blue")

 #Plot the Cumulative Probability Graph
 plot(y, type="n", main="", xlab="", ylab="", xaxt="n", yaxt="n")
 pardat <- par()
 yaxisdat <- seq(pardat$yaxp[1], pardat$yaxp[2], (pardat$yaxp[2]-pardat$yaxp[1])/pardat$yaxp[3])
 axis(2, at=yaxisdat, labels=paste(100*yaxisdat, "%", sep=""), las=2, padj=0.5, cex.axis=0.7, hadj=0.5, tcl=-0.3)
 mtext("Cumulative Probability", 2, line=2.3)
 abline(h=yaxisdat, col="lightgray")
 abline(v=xaxisdat, col="lightgray")
 lines(y, type="h", lwd=3, col="blue")

 axis(1, at=xaxisdat, padj=-2, cex.axis=0.7, hadj=0.5, tcl=-0.3)
 mtext("Number of Nuclear Accidents Per Century", 1, line=1)
 legend("topright", legend=c("99% Probability - 20 Accidents or More", " 1% Probability - 46 Accidents or More"), bg="white", cex=0.8)

 #Calculate the 1% and 99% values
 qpois(0.01, 32.2, lower.tail = FALSE)
 qpois(0.99, 32.2, lower.tail = FALSE)

 #Fit the Severity Data
 z <- c(rep(0,10), 1, rep(3,2), rep(4,3), rep(5,2), 7)
 zdis <- fitdist(z, "nbinom")
 plot(zdis, lwd=3, col="blue")
 summary(zdis)

Edit (03/20/2011) ======================================================

J Presley: I'm sorry I couldn't finish this up yesterday. You know how it is on weekends, lots of duties.

The last step in this process is to assemble a simulation using the Poisson Distribution to determine when an event happens, and then the Negative Binomial Distribution to determine the severity of the event. You might run 1000 sets of "century chunks" to generate the 8 probability distributions for Level 0 through Level 7 events. If I get the time, I might run the simulation, but for now, the description will have to do. Maybe someone reading this stuff will run it. After that is done, you'll have a "base case" where all of the events are assumed to be INDEPENDENT.

Obviously, the next step is to relax one or more of the above assumptions. An easy place to start is with the Poisson Distribution. It assumes that all events are 100% independent. You can change that in all sorts of ways. Here are some links to Non-homogeneous Poisson Distributions:

http://www.math.wm.edu/~leemis/icrsa03.pdf

http://filebox.vt.edu/users/pasupath/papers/nonhompoisson_streams.pdf

The same idea goes for the Negative Binomial Distribution. This combination will lead you down all sorts of paths. Here are some examples:

http://surveillance.r-forge.r-project.org/

http://www.m-hikari.com/ijcms-2010/45-48-2010/buligaIJCMS45-48-2010.pdf

http://www.michaeltanphd.com/evtrm.pdf

The bottom line is, you asked a question where the answer depends on how far you want to take it. My guess is, someone, somewhere will be commissioned to generate "an answer" and will be surprised at how long it takes to do the work.

Edit (03/21/2011) ====================================================

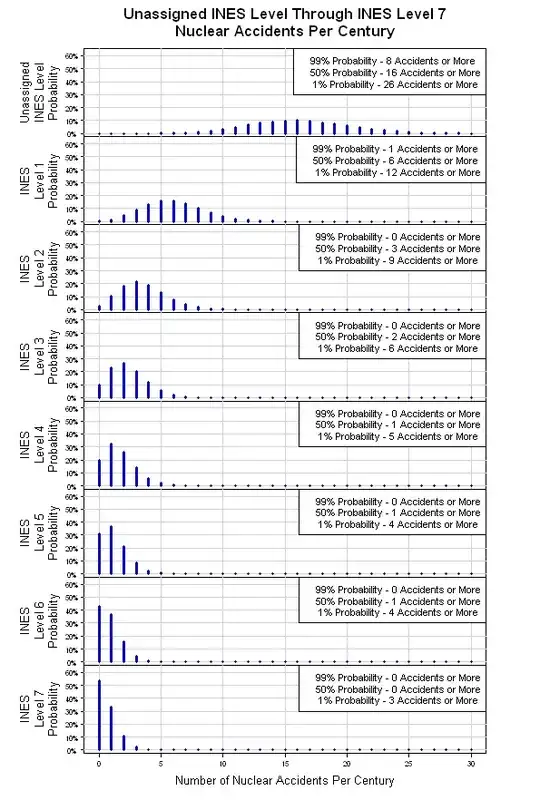
I had a chance to slap together the above mentioned simulation. The results are shown below. From the original Poisson Distribution, the simulation provides eight Poisson Distributions, one for each INES Level. As the severity level rises (INES Level Number rises), the number of expected events per century drops. This may be a crude model, but it's a reasonable place to start.

enter image description here

bill_080
  • 3,458
  • 1
  • 20
  • 21
  • How big are those generators? I would have guessed either a Skycrane or Mi-26 could haul them in, at the very least in pieces. – cardinal Mar 18 '11 at 19:44
  • There are (at least) two reasons for inadequate backup power in my understanding...1. the tidal wave took out the fuel tanks for the standby generators (inadequate tidal wave protection) 2. Inadequate batteries to keep essential equipment running until replacement power was available (likely impractical). Both of these situations are part of a large and complex probabilistic safety analysis of multiple scenarios. However, the bottom line is...the lower your probability criteria is....the more stringent your design will be (cont'd) –  Mar 18 '11 at 23:33
  • As a former nuclear reactor designer I am unaware of anyone who ever considered the 'total reactor population of the world' when estimating risk. The last few days have made me wonder whether this should not be the case in future. This is what prompted my question. –  Mar 18 '11 at 23:34
  • 1
    Why would one use such a strict criteria ? Because the consequences of such (potentially) low frequency events are so large we need to try to eliminate them completely. Again, economics will limit just how much we can do in this regard. –  Mar 18 '11 at 23:39
  • @JPresley: If I had to do such a calculation, I think it's more of a "when" than an "if" situation. As a simple model, I would use a Poisson Distribution for the "when", and maybe a Lognormal Distribution (Gamma??, Exponential??) for the magnitude of the problem. That's why several layers of backups/contingencies are necessary. – bill_080 Mar 19 '11 at 01:05
  • @bill_80: I am not sure but I think you may be confusing my question with the probability/risk associated with a single reactor (or site).There is already a well established set of probabilistic models dealing with this. There are also 'deterministic' models looking at what backups are needed. If I have read you wrong, I would need to see an example of your proposed calculation to understand it. My stats knowledge is somewhat 'rusty'. –  Mar 19 '11 at 04:29
  • @JPresley: My answer was too long for a comment. So, I added some things to my original answer. See the above. – bill_080 Mar 19 '11 at 20:01
  • @bill_080....thank you for the hard work you put into this. I just found this site and I am amazed at the level of responses one gets here –  Mar 21 '11 at 02:45
2

The underlying difficulty behind the question is that situations that have been anticipated, have generally been planned for, with mitigation measures in place. Which means that the situation should not even turn into a serious accident.

The serious accidents stem from unanticipated situations. Which means that you cannot assess probabilities for them - they are your Rumsfeldian unknown unknowns.

The assumption of independence is clearly invalid - Fukushima Daiichi shows that. Nuclear plants can have common-mode failures. (i.e. more than one reactor becoming unavailable at once, due to a common cause).

Although probabilities cannot be quantitatively calculated, we can make some qualitative assertions about common-mode failures.

For example: if the plants are all built to the same design, then they are more likely to have common-mode failures (for example the known problem with pressurizer cracks in EPRs / PWRs)

If the plant sites share geographic commonalities, they are more likely to have common-mode failures: for example, if they all lie on the same earthquake fault line; or if they all rely on similar rivers within a single climatic zone for cooling (when a very dry summer can cause all such plants to be taken offline).

410 gone
  • 1,028
  • 8
  • 23
  • Agreed -- it is folly to assign a probability to so-called Fourth Quadrant events such as this, or to even think we can predict them. All we can do is to make the system robust to their negative effects through redundancies etc. – Gilead Mar 19 '11 at 15:32
  • I don't fully agree. The Tsunami was not unanticipated, the 'level' of the Tsunami was unanticipated. The plant was 'apparently' designed for a 7 meter Tsunami based on historical probabilty information. This was considered acceptable based on some probabilistic arguments by someone. If the criteria was more stringent than a 'less probable' wave hejght would have been required in the design...this is my point... –  Mar 20 '11 at 00:06
1

As commentators pointed out, this has the very strong independency assumption.

Let the probability that a plant blows up be $p$. Then the probability that a plant does not blow up is $1-p$. Then the probability that $n$ plants do not blow up is $(1-p)^n$. The expected number of plants blown up per year is $np$.

In case you're interested: binomial distribution.

bayerj
  • 12,735
  • 3
  • 35
  • 56
  • Thanks Bayer I understand Binomial but it is early AM and I am getting old. I asked this question as I am a retired nuclear engineer who is wondering whether we should look more at the overall 'expectation value' than individual probabilities if we want to use probabilistic criteria for designing these plants. –  Mar 18 '11 at 14:36
  • 3
    @bayer, I am not voting this down (though I'm a bit tempted), but the independence assumption strikes me as wholely inappropriate in this circumstance and would lead to absurd inferences! – cardinal Mar 18 '11 at 15:12
  • 1
    I'm with @cardinal; independent failures is a ridiculous assumption. What if, say, the plants are near each other and in an area of high tectonic activity... – JMS Mar 18 '11 at 15:30
  • 1
    @cardinal is absolutely right: this is the crux of the matter. Engineers have used these kinds of independence assumptions without considering the possibility that *everything could go wrong at once* due to a common cause (such as an earthquake). That's (apparently) why multiple backups have failed in some Japanese installations. – whuber Mar 18 '11 at 15:34
  • You are right. I should have pointed that out. – bayerj Mar 18 '11 at 15:57
  • Just to clarify...Engineers do indeed consider 'common-mode' failures. That is why there are batteries for power systems in case of total site power loss. However, again assumptions have been made about how long it takes to restore power. In the case of the Japan accident, those assumptions were obviously wrong. –  Mar 18 '11 at 16:27
  • I am speculating that the 'design tsunami' was less than the 10 meter wave that actually happened. This would have probably been chosen based on historically based probability data. So, if the design probability criteria for the plant was forced lower by considering the combined probabilities of hundreds of plants that would have lead to more stringent design. Does that make sense ? It eventually boils down to overall economics as to what is possible. –  Mar 18 '11 at 16:54
  • @cardinal...what sort of 'absurd inferences' are you thinking of ? Please expand on that. Is this problem not similar to estimating the overall probability of a single plane crashing given an individual crash probability, p in a population of n airplanes ? I realize that everything is not 'totally independent', but wouldn't @bayer's suggestion provide a reasonable first estimate ? –  Mar 19 '11 at 04:54
  • 1
    I think in this particular case, assuming independence could mean miscalculating the relevant probabilities by several orders of magnitude. I am not an expert in either nuclear power plant design nor aircraft design and logistics. However, I would hazard a guess that the dependence structure of the risk to Japanese power plants is substantially stronger than for calculating probabilities of aircraft crashes. The nuclear power plants are simultaneously subject to the same risk factors: Off the top of my head: (a) earthquake, (b) tsunami, (c) electrical power grid, (d) common manufacturer,... – cardinal Mar 19 '11 at 14:18
  • 1
    ...(e) other geographical/geophysical design risks. Just the fact that they are all in close proximity of one another makes them have a common risk factor for simultaneous attack, let's say. The point is that you have to consider all these possible risk factors and for a lot of these, conditional on one of them occuring, the probabilities of multiple plant failures *simultaneously* jumps to close to one. Plane crashes seem a bit different as they are largely automonous and operate more widely geographically. Now, if air-traffic control over New York (TRACON) went down completely, all of a... – cardinal Mar 19 '11 at 14:24
  • ...sudden there is a simultaneous increase in risk across all airplanes in that space. Bad weather would also historically raise the risk of all planes in the airspace, though these risks have gone down dramatically over the last 20 years or so due to improved technology. So, I would *not* argue that plane crashes are independent either, but I'd guess they might tend to be "more" independent than nuclear reactor failures in someplace like Japan. Thoughts, @J Presley? – cardinal Mar 19 '11 at 14:28
  • @cardinal..your points are all valid...however, I feel I am being generally misunderstood here. The Fukushima Site (ie 6 reactors) was designed according to some probability criteria. For argument assume it is 10e-6/year. I am talking about now considering this reactor along with all the other reactor sites in the world designed to a similar (not necessarilly the same) probability criteria. This is a given. Now, with all these separate design probabilities of accidents we have an overall probability of an accident (or multiple accidents at separate sites) for any reactor anywhere in the world. –  Mar 19 '11 at 23:57
  • Don't confuse my question with anything to do with the fact that 4 reactors at the Fukushima site were damaged. This is essentially one 'event' in my discussion. –  Mar 20 '11 at 00:00
1

To answer the pure probabilistic question that J Presley presented, using bayer's notation (p=probability of an item failing), the the probability of at least one element failing is 1-P(none fail)= 1-(1-p)^n. This type of calculation is common in system reliability where a bunch of components are linked in parallel, so that the system continues to function if at least one component is functioning.

You can still use this formula even if each plant item has a different failure probability (p_i). The formula would then be 1- (1-p_1)(1-p_2)...(1-p_n).

Galit Shmueli
  • 1,090
  • 8
  • 10
  • Thank you Gail.....that is exactly the solution I wanted. By the way ...is there a general series (power,taylor or other) expansion for (1-p)^n that you know of ? –  Mar 21 '11 at 02:37
  • I have officially accepted Galit's (sorry I called you Gail) answer although Bayer's answer came close to the answer I was expecting to my original question. –  Mar 24 '11 at 22:41
  • Hi Galit, is it possible to link to any other reading on how you derived the given formula? Why is it 1-P vs. p^n – linamnt Jun 04 '21 at 20:17