It is possible because it depends on how your data suspend in the 3D space. See this doughnut for an example:
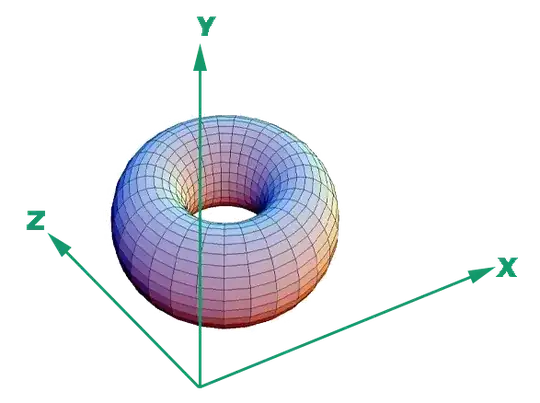
Suppose the doughnut is lying on the floor happily, from the y,z plane and at the x,y plane, the doughnut should look like an oblong shape (you will not see the hole). But when you look at the x,z plane (aka top down bird view), it'd be a circle.
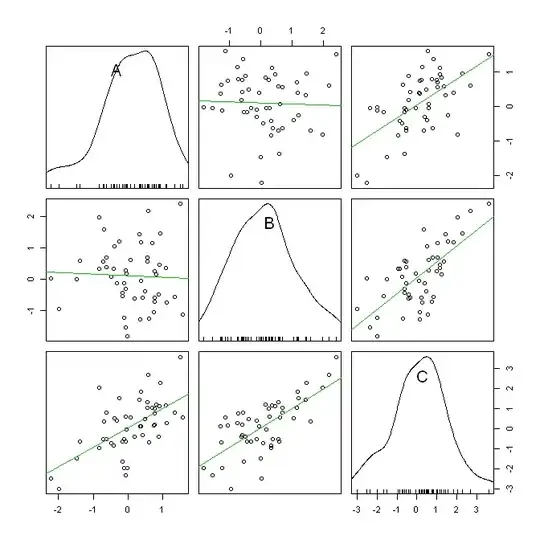
Your case is quite like this, with the far end of the doughnut slightly lifted upward to give the oblong shapes a bit of an angle and a high positive correlation. While when you look at the third pair, you don't see that high positive correlation anymore. Instead, you see a bit of an oval that shows a negative correlation between x and z.
As an extension, you'll find that in order for your expectation to be true, the cloud of data probably should look like a sausage stemming away from the origin. That way, no matter how you rotate the cube, you should still see a strong positive correlation from all the three sides.
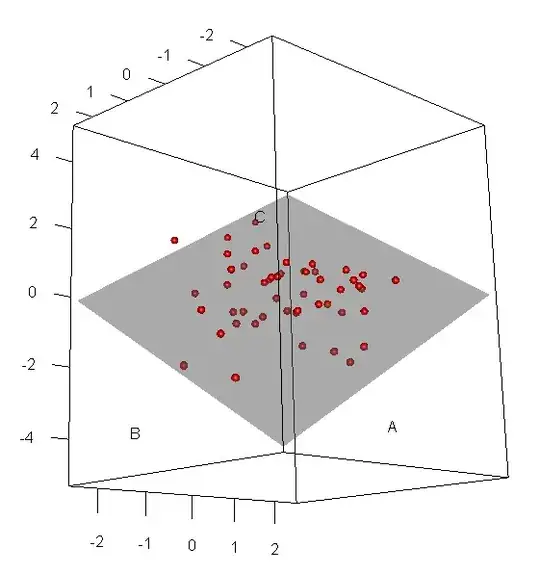
As for how to detect, examining all pair-wise scatter plots will help. Interactive 3D plot that allows you to rotate the axes should also let you get a better understanding of the actual dispersion.