I have a dataset comprised of continuous values that have about 30-50% zeros and a large range (10^3 - 10^10). I believe these zeros are not a result of missing data and are the result of the sensitivity of the machine taking the measurements. I would like to log10 transform this data so I can look at the distribution, but I'm not sure how to handle the zeros
I've done a lot of searching and found the following
- Add a small constant to the data like 0.5 and then log transform
- something called a boxcox transformation
I looked up boxcox transformation and I only found it in regards to making a regression model. I just want to visualize the distribution and see how it is distributed.
Currently when I plot a historgram of data it looks like this
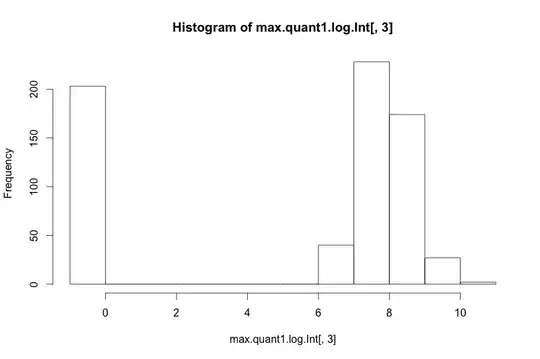
When I add a small constant 0.5 and log10 transform it looks like this
Is there a better way to visualize the distribution of this data? Im just trying to get a handle on what the data looks like in order to figure out what kind of tests are appropriate for it.