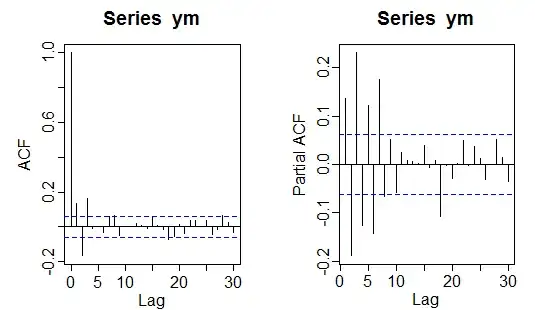
1) A pure AR(p) will have a cut off at lag p in the PACF:
ACF and PACF of a long AR(3) process
$ $
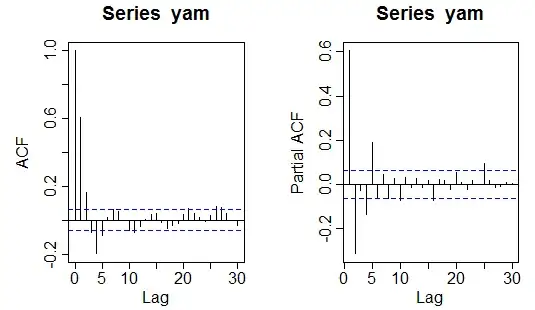
2) A pure MA(q) will have a cut off at lag q in the ACF.
ACF and PACF of a long MA(3) process
$ $
3) ARMA(p,q) will (eventually) have a decay in both; you often can't immediately tell p and q from empirical ACF and PACF -- though with some practice you can get better at it.
As Graeme Walsh points out, model identification is part of an iterative process (explicitly so in Box and Jenkins).
The ACF plot above suggests perhaps an MA(4) while the PACF plot might suggest an AR(5). One might instead try say an ARMA(1,1) and see what was "left over". There are other tools than the ACF and PACF, but they're usually even harder to interpret in practice (and may require even larger sample sizes to give a reliable indication).