6

Somebody mentioned, I don't remember who, that "there are many ways to specify the prior, you could even draw it!". It is clear to me that it is possible to actually draw the density of the prior using pen and paper and transform it into a histogram prior for use in an analysis. What I'm wondering is:

Has this approach been used/discussed in the literature? If not, are there reasons why this is generally not a good approach?
Rasmus Bååth
  • 6,422
  • 34
  • 57
  • 1
    Many, many people have used such approaches and they are extensively discussed in publications. Check out the top hits in [this Google search](https://www.google.com/search?q=prior+elicitation+probability+density+decision+analysis). – whuber Feb 04 '14 at 19:15
  • 1
    If you are fine with an interactive internet tool, you should try http://optics.eee.nottingham.ac.uk/match/uncertainty.php . – cmbarbu Dec 09 '15 at 18:29

2 Answers2

2

The TeachingDemos package for R has the TkBuildDist and TkBuildDist2 functions that provide interactive ways to draw a histogram and/or log density plot for creating a histogram. The first one uses left clicks to add points and right clicks to remove points and the second allows you to click on the tops of bars and drag them up or down. Both show the distribution as it is being created/modified and then return information about the distribution created (histogram and logspline fit).

This is not quite paper and pencil, but does accomplish the same general idea using a mouse.

Greg Snow
  • 46,563
  • 2
  • 90
  • 159
1

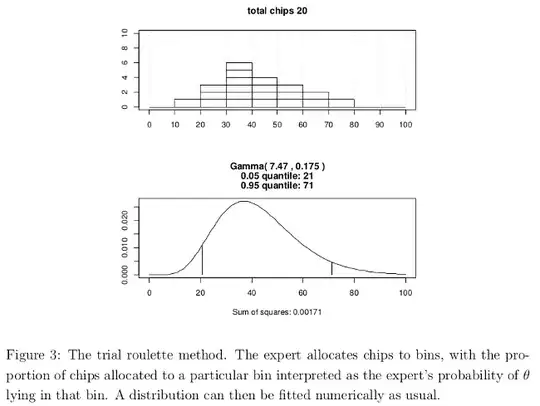
So, I found the "trial roulette method" described here which is I guess could be considered as drawing with chips. More info in the picture below:

enter image description here

Rasmus Bååth
  • 6,422
  • 34
  • 57