0

I have two types of samples:

  • some look like bimodal Gaussian mixture (Type A),
  • and some look like a Gaussian (Type B).

How can I programmatically classify/label them?

Language can be R, Python, Matlab, or anything else appropriate.

enter image description here

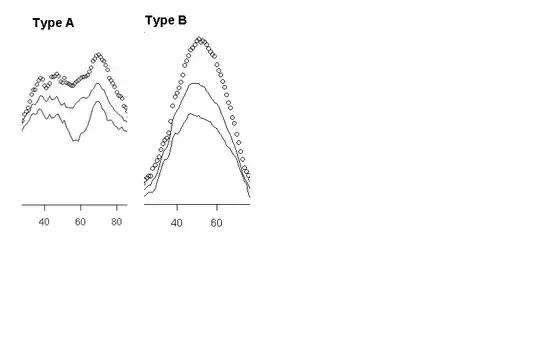
The data presented in the charts are Red values from jpeg images.

In R code:

# I read an image
I = readJPEG(file, native = FALSE)
# so I is now a matrix of 3 dimensions (rows, columns, 3 for Red/Green/Blue)

# I extract a vertical line from the image, and only the Red part
image_extract <- I[150:260, 194, 1]

# After reading several images, I plot the 3 images image_extract for each type (A,B)
plot(image_extract_1)
lines(image_extract_2)
lines(image_extract_3)

For Type A I plotted, 3 image extracts on the same chart. Same for Type B.

I hope it clarifies.

Timothée HENRY
  • 821
  • 2
  • 11
  • 24
  • 1
    Are these curves, or are you showing estimated density functions from data? – Aniko Jan 16 '14 at 13:44
  • @Aniko Those graphs are from R using the commans plot and lines with the data. The x-Axis is the row, and the y-Axis is the value analyzed. – Timothée HENRY Jan 16 '14 at 14:40
  • If the y-axis is not the density, I completely misunderstood your question. If the y-Axis is the dependent variable, you are rather interested in categorizing the plots according to some regression model. – Horst Grünbusch Jan 16 '14 at 16:07
  • @Aniko I added some explanation in my question. Hopefully that clarifies what the plots represent. – Timothée HENRY Jan 17 '14 at 16:01
  • 1
    [This answer](http://stats.stackexchange.com/questions/51062/test-for-bimodal-distribution/51085#51085) seems to be relevant. – Glen_b Mar 05 '14 at 22:21

2 Answers2

1

The best I could do so far was to try to fit a gaussian (see here for fitting a single/unimodal gaussian: How to fit data that looks like a gaussian?).

Then calculate the "difference" between the fit and the actual data. High "difference"would mean that it would not be a single gaussian, therefore it could be a double or something else.

Timothée HENRY
  • 821
  • 2
  • 11
  • 24
0

Usually the term for this is Gaussian Mixture Modeling, which along with kMeans is one of the most popular and widely implemented clustering algorithms out there.

Each Gaussian has a mean and variance that are learned from the data, often using the Expectation-Maximization algorithm to compute maximum likelihood.

One implementation is the R package EMCluster.

http://cran.r-project.org/web/packages/EMCluster/EMCluster.pdf

Another is mclust. http://cran.r-project.org/web/packages/mclust/vignettes/mclust.pdf

For python, sklearn has GMM: http://scikit-learn.org/stable/modules/mixture.html

For matlab, the Statistics toolbox has gmdistribution: http://www.mathworks.com/help/stats/gaussian-mixture-models.html

Joe
  • 1,121
  • 7
  • 11