I need an estimate of the average value $\bar{X}$ of the data within the shaded area of this graph, and its corresponding confidence interval.
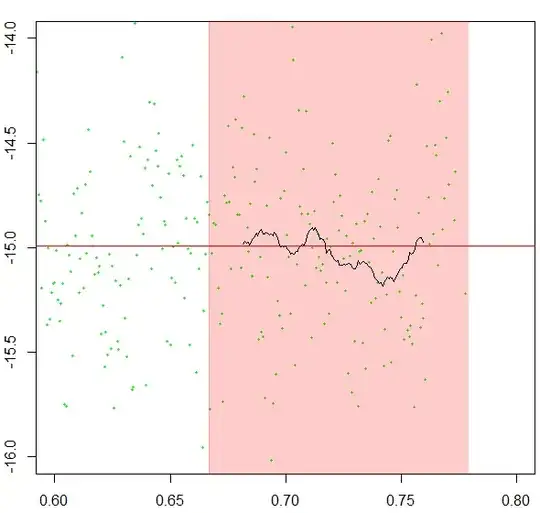
In the ideal case, the data would reflect some minor oscillations. I'm tempted to ignore this, and use the $CLT$ so the standard error would be $SE=\frac{S}{\sqrt{N}}$, where $S$ is the sample standard deviation, and $N$ is the total number of data points in the range. But I'm uncomfortable with this approach because I know this is not completely correct.
But the main problem is that sometimes the data is not stationary for the whole range, and can show multiple stationary segments, as shown below.
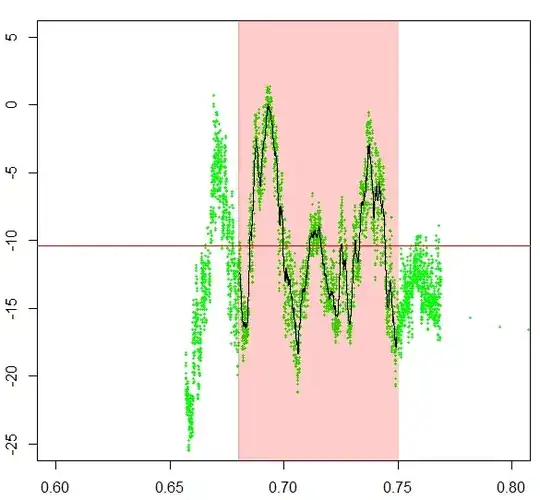
These issues invalidate any assumption of normality. I'm struggling to identify a proper method to calculate a single value for the mean and confidence interval for the whole data range. Any ideas?