1

I am kind of stuck with an easy question:

I have two data sets with experimental data. The data sets do not have the same size. I would like to show that these data sets are possibly coming from the same experiment.

I tried a two-sample $t$-test; it shows that the data are significantly different. Is there a way to generate something like a $p$-value for similarity instead of difference?

Update:
Here an example:
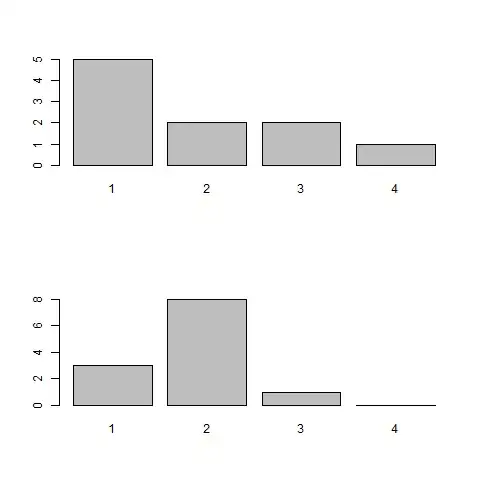
Date set 1 (Vector): 1 1 2 3 1 2 1 3 4 1 Mean: 1.9
Data set 2 (Vector): 2 2 1 2 2 1 1 2 2 3 2 2 Mean: 1.83

How would you now show that this data sets are from one experiment?

C.Colden
  • 115
  • 1
  • 6
  • Your last line makes the thrust of your question uncertain: because the t-test shows the *means* differ significantly, does that not put an end to the issue of whether the data could be drawn independently from a common distribution? Please tell us whether these apparent duplicate threads answer your question: http://stats.stackexchange.com/questions/68989, http://stats.stackexchange.com/questions/1202. If not, you likely will find many useful posts by searching our site for [similarity+distribution](http://stats.stackexchange.com/search?q=similarity+distribution). – whuber Jan 07 '14 at 16:26
  • (1) On what basis do you say that a t-test "shows that the data are significantly different"? I get a p-value > 0.8 (2) why are you using a t-test for these data? – Glen_b Jan 08 '14 at 18:18

2 Answers2

4

We need either an example or more details on the datasets:

  • is there more than one variable?
  • how many individuals per dataset?
  • is the Gaussian hypothesis sound for your problem?

The t-test will answer the question: is the mean the same between the two classes?

To test if the two data sets come from the same distribution, you could for example apply a Kolmogorov Smirnov test (ks.test in R). And there are alternative multivariate Kolmogorov Smirnov tests if you have two or more variables [Lopes et al., 2007].

With the example dataset:

 x <- unlist(read.table(text="1 1 2 3 1 2 1 3 4 1",sep=" "))
 y <- unlist(read.table(text="2 2 1 2 2 1 1 2 2 3 2 2",sep=" "))
 maxi <- max(c(x,y)) 
 xfac <- factor(x,levels=1:maxi)
 yfac <- factor(y,levels=1:maxi)
 # Plot
 layout(1:2)
 barplot(table(xfac))
 barplot(table(yfac))

Bar plots of the 2 samples

# Two sample test on the median
wilcox.test(x, y) # Similar medians
# Two sample Kolmogorov-Smirnov Test
ks.test(x, y) # Do not trust the p-value because the data is discrete
# Alternative?

Given the plot and the results of the tests, you might want to augment the number of individuals!

  • I updated my question with an example data set. – C.Colden Jan 07 '14 at 18:06
  • 2
    You can do much better using a $\chi^2$ test on these data (which form a contingency table). `ks.test` is not appropriate, primarily because these are discrete values. – whuber Jan 07 '14 at 18:54
  • Right ! Replaced in the code. Is it the correct use of chisq.test, though? Just a remark: these data do not form a contingency table. – Vincent Guillemot Jan 08 '14 at 11:05
0

The Kolmogorov-Smirnov test, and other non-parametric tests, will tell you if the samples come from the same distribution. KS in particular does not require equally numbers of samples, and the statistic can be converted to a p-value.

Superbest
  • 253
  • 3
  • 10