One shouldn't necessarily expect to find that $R^2$ improves by deleting an influential outlier; $R^2$ has a numerator and a denominator, and both are impacted by points with high Cook's distance.
It's easy to pick up a somewhat mistaken conception of $R^2$; this may lead you to have an expectation of $R^2$ that isn't the case.
As I mentioned, $R^2$ has a numerator and a denominator; adding an influential outlier will greatly increase the variation in the data (increasing the denominator). You might expect that would reduce $R^2$ -- but at the same time, if the point is sufficiently influential, almost all of that additional variation in the data will be explained by a line going through, or nearly through the outlier.
This may be easiest to see with an example.
Consider the following data:
    x       y
    1    0.56
    2    0.63
    3    3.28
    4    3.01
    5    5.42
    6    6.88
    7    7.69
    8    6.65
    9    7.49
   10    9.76
This has an $R^2$ of 91.6%
Now add a highly influential outlier to the above data:
    x       y
  100 -100.00
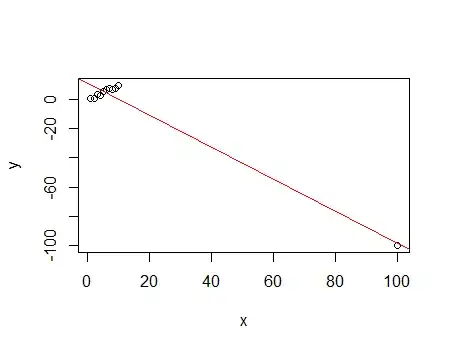
This has an $R^2$ of 96.4%
While the denominator of the $R^2$ increased from 88.07 to 10137, the numerator increased from 80.68 to 9769 - most of the variation in the data (over 90% of it!) is contributed by one observation, and that one is fitted quite well; this drives $R^2$.
To see that the fit to the rest of the data is actually much worse, simply compare their residuals; that lack of fit does very little to pull down $R^2$.
This example demonstrates not only that it can happen that $R^2$ can increase by adding an influential outlier, but shows how it can happen. (Conversely, if we start with the second data set and delete the influential outlier, $R^2$ will go down.)
It should serve as a cautionary tale - beware of interpreting $R^2$ as fit in any intuitive sense; it does measure a kind of fit, but it's a very particular measure of it, and the behaviour of that measure may not match your personal intuition.