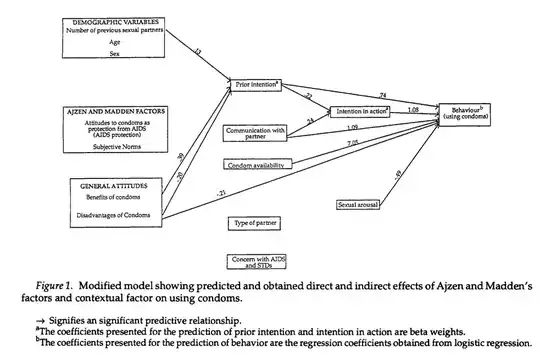
The diagram appears to represent a path analysis. A convention in such diagrams is to represent latent variables with circles, and measured variables with rectangular boxes. If latent variables were involved, this would be a structural equation model; since there is no indication that these variables were not measured directly (using a simply summed/averaged scale score basically counts as a direct measurement of the latent variable it represents via classical test theory), it does appear to be a path model, of which Wikipedia says this (with no particular reference cited, unfortunately):
Path analysis can be viewed as a special case of structural equation modeling (SEM) – one in which only single indicators are employed for each of the variables in the causal model. That is, path analysis is SEM with a structural model, but no measurement model.
FWIW, two lines in Wikipedia's SEM page corroborate the above statement, and I don't see any particular reason to argue with it.
I see from your comments that you're concerned about the use of logistic regression in the final step of the path analysis. This is not a problem. Traditional path analysis proceeds step-by-step in predicting endogenous (dependent) variables, beginning with those predicted by exogenous (purely independent) variables (with no inbound arrows, as with the three sets of variables on the left of your diagram). The first set of endogenous variables can then be used to predict other endogenous variables in subsequent steps involving separate regression analyses to construct a path model. I.e., the logistic regression can be performed after the first two OLS regressions predicting prior intention and intention in action. Modern modeling software can fit the entire model all at once, provide model fit statistics, and accommodate combinations of dichotomous and continuous DVs.
Those fit statistics provide you information about whether your model fits the data sufficiently, as @DLDahly finds lacking in this figure. In its defense, the presence of unconnected measures in this model (e.g., Azjen and Madden factors) suggests the authors attempted to use them as predictors in some way that isn't reflected in the figure itself – but hopefully is in the paper – to test their hypothesized model. Indeed, any set of regressions can be run and arranged as desired, but this is not a problem for purely exploratory research. If a particular, hypothesized model is to be tested, one should report the results for that model – the arrangement of which is not arbitrary – and distinguish these results from any exploratory post-hoc model tweaking. Furthermore, random error in endogenous variables can be identified at each step by noting the fraction of unexplained variance $(1-R^2)$ in each regression model if these are performed separately, or will be identified as the variance estimate for the endogenous variables if the entire model is fit all at once, so it is not ignored necessarily, though this figure does not include this information. Omission of insignificant pathways and error estimates is unfortunately common in SEM reporting, as figures tend to get cluttered quickly.
I also see you're concerned about sample size. Rules of thumb vary regarding recommendations for the minimum number of observations per parameter estimate: I've seen 5, 10, even 20 per estimate recommended. Hence with $n=66$, you could stand a halfway decent chance of fitting 3–13 parameters, depending partly on the quality of your model and the reliability of your measures. I wouldn't tell you not to at least try, but I might recommend crossing your fingers! You never really know what kind of model you can fit until you try (though with really big ones, you can be pretty sure that a small sample = bad news).
Plenty more advice for SEM could be offered depending on the nature of your data (cf. Regression testing after dimension reduction, Factor analysis of questionnaires composed of Likert items), but I'll just offer one more suggestion. One useful alternative for fitting path models with small datasets is partial least squares (PLS) regression. If you're not predicting any one DV with too many IVs, that will help reduce your sample size requirements, because power depends more on that than the overall number of parameters estimated for PLS (Marcoulides, Chin, & Saunders, 2009; Chin & Newsted, 1999). PLS modeling software is freely available through SmartPLS BTW. It can be a little tricky to set up at first, but I've used it myself; it's not half bad!
References
- Chin, W. W., & Newsted, P. R. (1999). Structural equation modeling analysis with small samples using partial least squares. In R. Hoyle (Ed.), Statistical Strategies for Small Sample Research (pp. 307–341). Thousand Oaks, CA: Sage Publications.
- Marcoulides, G. A., Chin, W. W., & Saunders, C. (2009). A critical look at partial least squares modeling. MIS Quarterly, 33(1), 171–175. Retrieved from http://citeseerx.ist.psu.edu/viewdoc/download?doi=10.1.1.217.4520&rep=rep1&type=pdf.