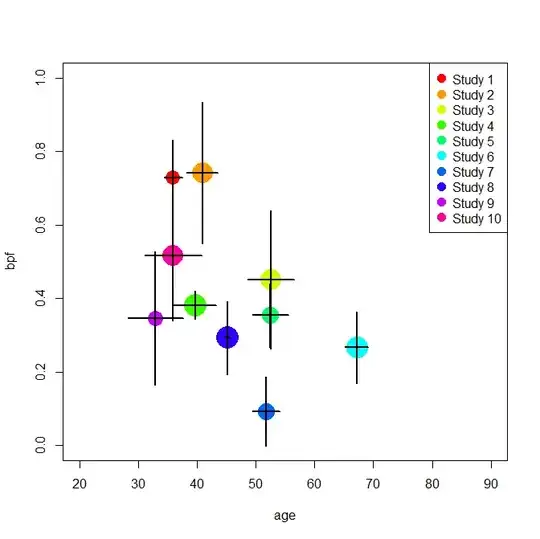
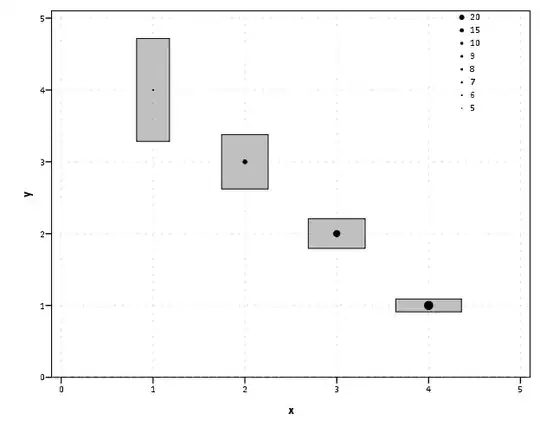
If your errors are really orthogonal in both directions I would probably suggest using boxes instead of error bars (if they aren't ellipses (Friendly et al. 2013) are probably a better choice). Below the image is SPSS code illustrating how to plot boxes in GPL.
data list free / x y pop.
begin data
1 4 5
2 3 10
3 2 15
4 1 20
end data.
compute xlow = x - (x*.4)/sqrt(pop).
compute xhigh = x + (x*.4)/sqrt(pop).
compute ylow = y - (y*.4)/sqrt(pop).
compute yhigh = y + (y*.4)/sqrt(pop).
formats ALL (F1.0).

*Boxes.
GGRAPH
  /GRAPHDATASET NAME="graphdataset" VARIABLES=x y xlow xhigh ylow yhigh pop
  /GRAPHSPEC SOURCE=INLINE.
BEGIN GPL
 SOURCE: s=userSource(id("graphdataset"))
 DATA: x=col(source(s), name("x"))
 DATA: y=col(source(s), name("y"))
 DATA: pop=col(source(s), name("pop"))
 DATA: xlow=col(source(s), name("xlow"))
 DATA: xhigh=col(source(s), name("xhigh"))
 DATA: ylow=col(source(s), name("ylow"))
 DATA: yhigh=col(source(s), name("yhigh"))
 TRANS: casenum = index()
 GUIDE: axis(dim(1), label("x"))
 GUIDE: axis(dim(2), label("y"))
 SCALE: pow(aesthetic(aesthetic.size))
 ELEMENT: polygon(position(link.hull((xlow + xhigh)*(ylow + yhigh))), color.interior(color.grey), split(casenum), transparency.interior(transparency."0.5"))
 ELEMENT: point(position(x*y), color.interior(color.black), size(pop))
END GPL.
I can show you how you would plot error bars in SPSS, but I think this is much clearer a picture. For scatterplots of more and overlapping cases things to keep in mind are to make the box elements semi-transparent so overlap is more clear. Also in the first graph plotting the point at the center of the rectangle may seem superflous, but this becomes more necessary as the area of the box shrinks, places that have higher certainty in the estimates shrink to nothing in the plot otherwise.
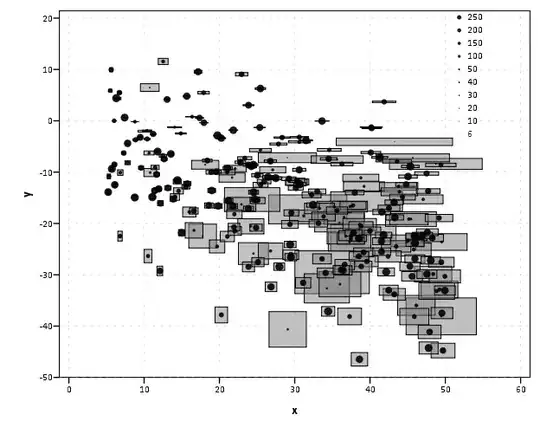
Below is a similar example extended to 246 observations.
set seed 10.
input program.
loop #i = 5 to 250.
  compute x = RV.UNIFORM(5,50).
  compute y = -.5*x + RV.NORMAL(0,10).
  compute pop = #i.
  end case.
end loop.
end file.
end input program.
compute xlow = x - (x*.4)/sqrt(pop).
compute xhigh = x + (x*.4)/sqrt(pop).
compute ylow = y - (y*.4)/sqrt(pop).
compute yhigh = y + (y*.4)/sqrt(pop).
formats ALL (F1.0).

*Boxes.
GGRAPH
  /GRAPHDATASET NAME="graphdataset" VARIABLES=x y xlow xhigh ylow yhigh pop
  /GRAPHSPEC SOURCE=INLINE.
BEGIN GPL
 SOURCE: s=userSource(id("graphdataset"))
 DATA: x=col(source(s), name("x"))
 DATA: y=col(source(s), name("y"))
 DATA: pop=col(source(s), name("pop"))
 DATA: xlow=col(source(s), name("xlow"))
 DATA: xhigh=col(source(s), name("xhigh"))
 DATA: ylow=col(source(s), name("ylow"))
 DATA: yhigh=col(source(s), name("yhigh"))
 TRANS: casenum = index()
 GUIDE: axis(dim(1), label("x"))
 GUIDE: axis(dim(2), label("y"))
 SCALE: pow(aesthetic(aesthetic.size))
 ELEMENT: polygon(position(link.hull((xlow + xhigh)*(ylow + yhigh))), color.interior(color.grey), split(casenum), transparency.interior(transparency."0.5"))
 ELEMENT: point(position(x*y), color.interior(color.black), size(pop), transparency.interior(transparency."0.1"), transparency.exterior(transparency."1"))
END GPL.
Below is some code showing how to plot error bars instead of boxes in SPSS. Ellipses is more difficult, as you need some estimate of the correlation between the errors. Here I've posted some code that provides a function to draw the points for an ellipse in SPSS given the centroid, major and minor axis, and the degree of the slope. See this post on how to calculate an ellipse given a covariance matrix.
*Error Bars.
GGRAPH
  /GRAPHDATASET NAME="graphdataset" VARIABLES=x y xlow xhigh ylow yhigh
  /GRAPHSPEC SOURCE=INLINE.
BEGIN GPL
 SOURCE: s=userSource(id("graphdataset"))
 DATA: x=col(source(s), name("x"))
 DATA: y=col(source(s), name("y"))
 DATA: xlow=col(source(s), name("xlow"))
 DATA: xhigh=col(source(s), name("xhigh"))
 DATA: ylow=col(source(s), name("ylow"))
 DATA: yhigh=col(source(s), name("yhigh"))
 TRANS: casenum = index()
 GUIDE: axis(dim(1), label("x"))
 GUIDE: axis(dim(2), label("y"))
 ELEMENT: edge(position((xlow + xhigh)*y)))
 ELEMENT: edge(position(x*(ylow + yhigh)))
 ELEMENT: point(position(x*y), color.interior(color.black))
END GPL.