0

I'm trying to analyze a part of European Social Survey data.
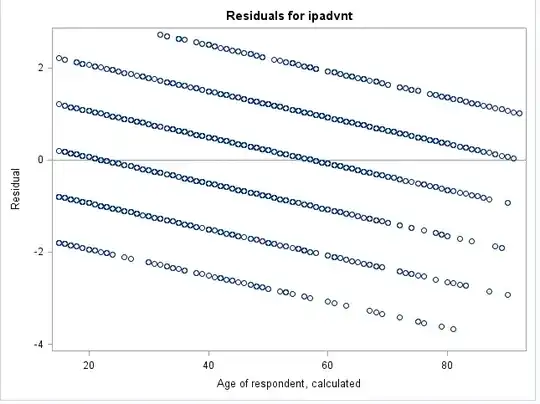
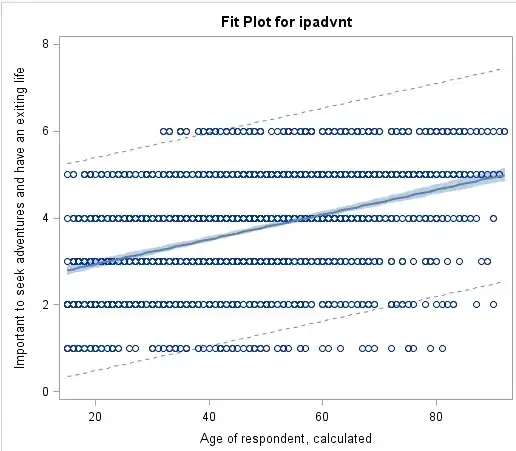
The outcome has to be treated as continuous, however it can take only discrete values from 1 to 6. The predictor variable is age. I fitted a simple linear regression model and now I need to check model's assumptions.I have this residuals vs. predictor variable plot and a fit plot. Could you please help me to interpret them? As I understand SD of the error terms is not constant, but what else can we read from these plots?

Thank you very much!

this enter image description here

user2575760
  • 441
  • 4
  • 15
  • 1
    One thing that might help you visualize what's happening in the plots is to jitter in both y and x (note that if it is in completed years, as is typically the case, Age is also discrete). Which is to say, add a small amount of 0 mean uniform (say) noise in both directions, scaled so that the fuzzed data is still distinct if the x or y values differ (that is, the width is less than half the gap between values) – Glen_b Dec 08 '13 at 21:32
  • Also note that if y is limited to values between 1 and 6, a linear model seems unlikely to work over a wide range - you'd expect the relationship to flatten at the ends, as it gets closer to the bounds in y. One thing you could do is compare a smooth of the relationship with a linear fit. (What software are you working in?) – Glen_b Dec 08 '13 at 21:36
  • Hmm, can't directly help with SAS. – Glen_b Dec 09 '13 at 11:35
  • The very closely related question at http://stats.stackexchange.com/questions/25068/interpreting-plot-of-residuals-vs-fitted-values-from-poisson-regression/30276#30276 may be instructive in this context. – whuber Jan 05 '14 at 22:39

0 Answers0