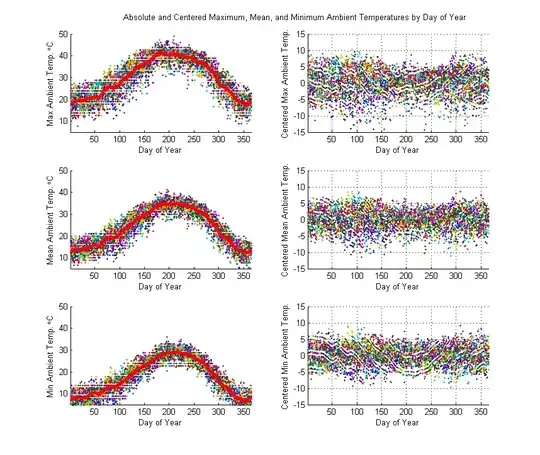
I have been asked to develop control charts for my company - or some other means of quickly identifying when ticket sales are "out of control" and not just a random blip. The data we are looking at are seasonal with a positive trend (sales revenue).
It has been suggested that I use an exponentially-weighted moving average (EWMA) chart but my (limited) understanding is that these are only appropriate for use on data with a constant mean.
My gut instinct is to apply an ARIMA model and to assess whether observations fall within confidence limits derived from that... but I'm not confident enough to be sure this is the right approach.
My question therefore is:
- Is it appropriate to use control charts to monitor revenue sales
- What would be the best model to use
Please bear in mind that it needs to be administered by somebody with undergraduate maths, and explained to true lay people.
