3

I'll try to make the matter as clear as possible given the circumstances. My boss asked me to look at an old report a former employee wrote around a couple of months ago. Apparently the report contains some very useful information but, unfortunately, no one is able to understand it because it is written in "mathematics".

The main node of the report is a linear regression formula for the predictions of future data for non-linear function. Consider to have the following:

enter image description here

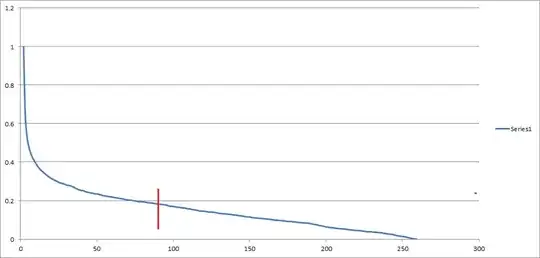
The Y-axis report a percentage (1 equals 100%). Now imagine to only have the part of the data before the red line. My former colleague figured out that the formula to estimate the second part of the data was:

$$R(t) = 1 - d t^{1/\alpha}$$

While I did understand most of the formula I cannot understand what $d$ and $\alpha$ represent. By any chance, are they a common sign for something I am missing?

Please, ask if something is not clear.

whuber
  • 281,159
  • 54
  • 637
  • 1,101
Edgar Derby
  • 614
  • 1
  • 6
  • 16
  • 1
    They'll probably just be parameters (constants) that need to be estimated from the data, and then the estimates of the constants are used to project the curve past the red line. – Glen_b Nov 12 '13 at 09:10
  • Just some comments and then a question: (1) this is not "linear regression." If you're interested in researching such techniques, look instead at "nonlinear regression" or "curve fitting." (2) The data shown clearly are badly described by a formula of this type, as evidenced by (1) the values reach $0$ for large but finite $t$ and (2) the values reach $1$ at a strictly positive $t$. What does this "series" represent, by the way? *This matters* for the analysis. The apparent consistent decrease in the values suggests the plot shows derived, rather than original, data, which is important. – whuber Nov 12 '13 at 14:07

2 Answers2

1

The equation that you provide appears to be describing the shape of the entire curve, not just the linear portion to the right of the red line. If you set d=0.31 and alpha=4.7, you should be able to draw a curve very similar to the one you provide. For example, when t = 100, R(t) = 1 - 0.31 * 100^(1/4.7) = 0.17.

Jean V. Adams
  • 494
  • 3
  • 10
0

This looks to me like a power law curve fit. Using the least squares estimators given here, I think this should work:

Let $Y_i = 1-R(t)$. Then

$ \begin{align} \hat{\alpha} &= \frac{n \sum_{i=1}^{n}(\ln t_i)^2 - (\sum_{i=1}^{n}\ln t_i)^2}{n \sum_{i=1}^{n}(\ln t_i \ln Y_i) - \sum_{i=1}^{n}(\ln t_i) \sum_{i=1}^{n}(\ln Y_i)} \\ \hat{d} &= \frac{\sum_{i=1}^{n}(\ln Y_i) - \alpha \sum_{i=1}^{n}(\ln t_i)}{n}\\ \hat{R(t)} &=1 - \hat{d} t^{1/\hat{\alpha}} \end{align} $

EDIT: I tried prototyping these estimators on some sample data and I think there's something off here. This should get you on the right track, in any event.

David Marx
  • 6,647
  • 1
  • 25
  • 43