I wish to calculate the value on a normal distribution (having the mean and stdev), where P(Z >= ?) = 67%.
I'm new to stats, so in case my question is unclear, I will draw a picture:
I wish to calculate the value on a normal distribution (having the mean and stdev), where P(Z >= ?) = 67%.
I'm new to stats, so in case my question is unclear, I will draw a picture:
There are a variety of ways you might find that particular value. Since you seem to be using tables, that's what I'll discuss.
Tables:
If you're supplied with standard normal tables, they may be arranged in any number of different ways.
One common way is to give a table of the cdf; other tables might give areas above 0.5 instead, or they might give upper tail areas. (Some sets of tables may also have a table or partial table of the inverse cdf.)
Let's look at a table of the standard normal cdf
 Z    0.00    0.01    0.02    0.03    0.04    0.05    0.06    0.07    0.08    0.09
0.0  0.5000  0.5040  0.5080  0.5120  0.5160  0.5199  0.5239  0.5279  0.5319  0.5359
0.1  0.5398  0.5438  0.5478  0.5517  0.5557  0.5596  0.5636  0.5675  0.5714  0.5753
0.2  0.5793  0.5832  0.5871  0.5910  0.5948  0.5987  0.6026  0.6064  0.6103  0.6141
0.3  0.6179  0.6217  0.6255  0.6293  0.6331  0.6368  0.6406  0.6443  0.6480  0.6517
0.4  0.6554  0.6591  0.6628  0.6664  0.6700  0.6736  0.6772  0.6808  0.6844  0.6879
0.5  0.6915  0.6950  0.6985  0.7019  0.7054  0.7088  0.7123  0.7157  0.7190  0.7224
0.6  0.7257  0.7291  0.7324  0.7357  0.7389  0.7422  0.7454  0.7486  0.7517  0.7549
0.7  0.7580  0.7611  0.7642  0.7673  0.7704  0.7734  0.7764  0.7794  0.7823  0.7852
0.8  0.7881  0.7910  0.7939  0.7967  0.7995  0.8023  0.8051  0.8078  0.8106  0.8133
0.9  0.8159  0.8186  0.8212  0.8238  0.8264  0.8289  0.8315  0.8340  0.8365  0.8389
1.0  0.8413  0.8438  0.8461  0.8485  0.8508  0.8531  0.8554  0.8577  0.8599  0.8621
1.1  0.8643  0.8665  0.8686  0.8708  0.8729  0.8749  0.8770  0.8790  0.8810  0.8830
1.2  0.8849  0.8869  0.8888  0.8907  0.8925  0.8944  0.8962  0.8980  0.8997  0.9015
1.3  0.9032  0.9049  0.9066  0.9082  0.9099  0.9115  0.9131  0.9147  0.9162  0.9177
1.4  0.9192  0.9207  0.9222  0.9236  0.9251  0.9265  0.9279  0.9292  0.9306  0.9319
...
Now that table gives areas like so:
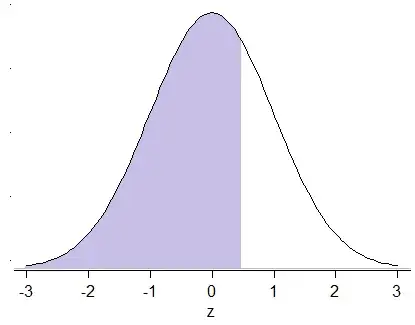
That table doesn't give areas below $0.5$, which correspond to x-values below the mean (negative values of $z$).
You can use the above table to work out an area under the curve to the left of a given value on the x-axis (the z-value for a standard normal), or you can take an area and work out the value on the x-axis that will give that area to the left.
But you want the areas like so:
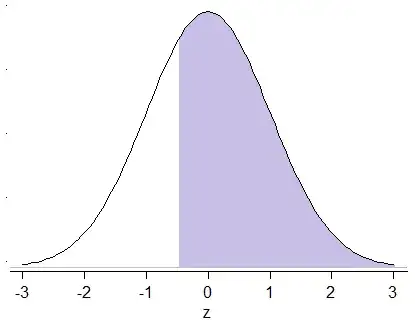
It would be easy if the left tail areas smaller than $0.5$ were in the table, because then you could take the $z$ value with an area of $1-0.67 = 0.33$ to the left of it, but as I mentioned, they're usually left out of the table (deliberately).
Conveniently, the standard normal distribution is symmetric about zero.
This means that the z-value in the second plot is the negative of the z-value in the first plot.
So if you want to know the z-value with $0.67$ of the area above it, work out the z-value with $0.67$ of the area below it, and then change its sign (in this case, put a "-" sign in front of the z value you look up in the table).
According to my table above, $z = 0.44$ has $0.67$ of the area to the left of (below) it. That means $z = -0.44$ has 0.67 of the area to the right of (above) it.
So then to get the x-value, you multiply by your given standard deviation and add the given mean. So $x=\text{mean} -0.44\times \text{stdev}$ is the x-value that will have 0.67 of the area above it... i.e. such that $P(X>x) = 0.67$