I’ve got a sample of pairwise distances between points in a 2D picture. Some of these points lie within the same object. Their distance to each other is thus smaller than some well-defined threshold (the object’s diameter). Points that lie in different objects (predominantly) have a pairwise distance greater than said threshold. Points that lie within the same object are however rare (<10%).
I would like to determine this distance threshold empirically from my sample.
For “appropriate” parameters (well, herein lies the rub, doesn’t it?) the threshold is visible in the density plot:
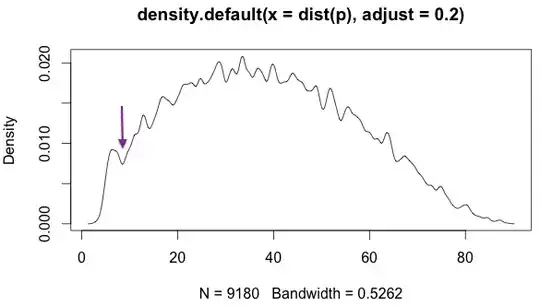
The threshold is marked by the arrow. This is the objectively right cut-off for my application: it is the dip after the first tall plateau which corresponds to the distribution of the few points lying within the same object, and it corresponds to the object diameter that can be individually verified in the original picture, but not easily automatically deduced from my data.
Unfortunately, I have no idea how to determine it in an automated fashion. Even the adjust argument / bandwidth for the density function has been found by trial and error, and a different input data set I’ve tried requires a different bandwidth.
Is there any hope? Or should I just give up?