What tests would I use to see if two distributions are 'significantly' different in dispersion if they are thick tailed, like a t-distribution? thanks
Asked
Active
Viewed 1,570 times
1
-
2Is the null that the distributions are identical apart from the possibility of a change in spread? Or is it that the centers might also be different? Or is it that the distributions might be differently shaped (such as two different t-distributions?) – Glen_b Nov 04 '13 at 03:45
-
The centers are not different, but the distributions are identical except for the dispersion measure (median absolute devidation (R mad) is what I am using to measure dispersion) – gpc Nov 04 '13 at 14:13
-
That's important information. If you want a test where dispersion is measured by median absolute deviation, then you could just do a permutation test (or randomization test if the samples are too large to evaluate all permutations). – Glen_b Nov 04 '13 at 22:19
1 Answers
2
Here's the situation as I understand it:
1) you want to test for equality of spread with heavy tailed distributions.
2) you assume they will only differ in spread.
3) you have a measure of spread already in mind (median absolute deviation); what you need is a single statistic that identifies how much those spreads are unalike (since it's a measure of scale, their ratio is a reasonable choice, but in fact for what I am going to suggest we're going to be able to do something simpler).
4) the usual assumptions like independence etc apply.
(5) it sounds like you are using R; if I give any example code I'll use R also)
With these assumptions, under the null, the distributions of the two samples are the same; the null is a test of identical distributions, the test statistic is a measure that's sensitive to a particular kind of deviation from identical distributions.
If you want a test where dispersion is measured by median absolute deviation, then in these circumstances you could just do a permutation test (or randomization test if the samples are too large to evaluate all permutations).
Because it's a permutation test, we don't have to take the ratio of mads, anything whose size is sensitive to deviations from the null would also work. In this case I'm going to discuss looking at the mad of the smaller-sized sample, in the hopes of calculating a bit faster (though calculation speed shouldn't be the only consideration, it allows me to make some useful points about what we're doing along the way).
If the null were true, the labels for the two groups are 'arbitrary' - we could combine the samples and randomly relabel the observations without altering their underlying distribution. However, under the alternative, the labels signify something important - that we are sampling from distributions that differ in spread. In that case, the sample test statistic won't be 'typical' of the permutation distribution.
Basic outline of how to do a test of equality of distributions using a specified statistic
Permutation test:
Combine both samples and allocate the set of group labels in all possible combinations to find the distribution of the test statistic under the null of identical distributions, calculating the test statistic each time.
find how far 'in from the end(s)' the sample value occurs, and calculate the proportion of null values from the permutation distribution that are at least as extreme as it. (the p-value)
If the sample statistic is sufficiently extreme in the null distribution (if that p-value is low enough), reject the null.
In this case I assume you want a two-tailed test and then (with the mad of the smaller group as the statistic) we have the problem of what to count up to in the other tail (this would be easy with the ratio, since we just take the reciprocal). However we'll take the ratio to the combined mad (which doesn't change so we don't have to sample that), and use the reciprocal from that to get the cutoff in the other tail.
The randomization test is basically the same as the above but instead of evaluating all possible permutations it simply samples (with replacement) from the set of permutations.
[Another alternative would be to use bootstrapping; in that case you're seeing whether a ratio of median absolution deviations of 1 could plausibly have come from the bootstrap distribution of the ratio. In this case you would resample with replacement within groups and compute the ratio each time, and see whether the null value is consistent with it (would be inside a confidence interval for the ratio). But bootstrapping tends not to work so well on medians, and you would require fairly large samples. A smoother (but similarly robust) statistic might work better.]
Example (here I've chosen the sample sizes to be just a little bit too large to do a permutation test; there's 3.2 billion combinations - you could do it if you were determined to get the exact permutation distribution, but we won't)
# create some data with heavy tail and different spread
set.seed(3498732)
nrand <- 100000
x <- rt(20,df=3)*5+50
y <- rt(15,df=3)*20+50
print(x,d=4)
print(y,d=4)
xy <- c(x,y)

# do the randomization
madrand <- replicate(nrand,mad(sample(xy,15),constant=1))
mm <- mad(xy,constant=1)
t <- mad(x,constant=1)/mm
tr <- range(t,1/t)
madrand <- madrand/mm
hist(madrand,n=200)
abline(v=mad(x,constant=1)/mm,col=3)
abline(v=1/(mad(x,constant=1)/mm),col=3)

(pvalue <- (sum(madrand <= tr[1])+sum(madrand >= tr[2]))/nrand)
This produces a p-value of 0.114 (with a binomial standard error of 0.001); the histogram looks like this:
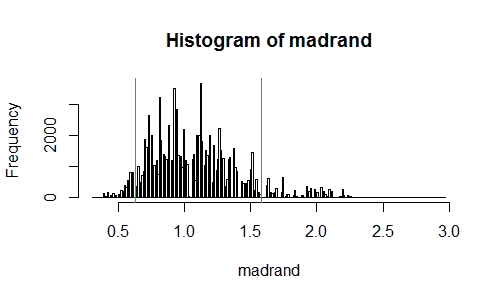
[This looks 'rough' like I haven't sampled enough. Not so - the exact permutation distribution will look like this too; it's a result of using a median (of the absolute deviations from the median) on small samples -- the resulting statistic has a somewhat "clumpy" distribution even though the original data was continuous.]
If I'd been clever I'd have used a constant in the calls to mad of 1/mm.
If we wanted to retain the scale of the mad in our results, we could still do the other tail by computing mm^2/mad(x,constant=1) as the cutoff and get the same resulting p-value.
Hopefully that's clear enough, but I can elaborate if needed.
The ratio of mads that I originally discussed can be done almost as easily - the sampling will be slower (it will take maybe twice as long to run) but the fiddling around at the end would be simpler.
Edit: If you're not wedded to the mad, the package exactRankTests has some alternative robust permutation tests of equality of spread.
Glen_b
- 257,508
- 32
- 553
- 939
-
-
1For the same reason we don't do a KS test when we really only want to compare means -- because the alternative hypothesis wasn't of general differences in distribution, but of a specific type of difference (and even as measured by a specific statistic\*), and the OP was prepared to assume equality of distributions outside of that specific difference. The two sample KS test would be wasting power on a host of alternatives the OP assumes were not there. If the question had been 'how to I do an omnibus test for differences in distribution', I might have suggested such a test. ...(ctd) – Glen_b Nov 04 '13 at 23:34
-
(ctd) ... \* without that specific statistic mentioned in the question I might have suggested a nonparametric (rank-based) test of equality of spread. – Glen_b Nov 04 '13 at 23:38
-
1@Felix sorry I forgot to flag ("@Felix") that response back to you, so I am doing it now. That above response might read more dismissively than I intend -- it was a good question to ask. – Glen_b Nov 04 '13 at 23:40
-
Thank you so much - not being a statistician, I was going to jump in with KS, but I felt uncomfortable with its assumptions. this was a lot of work on your part and the example explained it perfectly - Thanks again... – gpc Nov 05 '13 at 02:17
-
Uh. Wait. Which assumptions of Komogorov Smirnov are a problem? The same things may be an issue with what I did. – Glen_b Nov 05 '13 at 02:59