I am new to statistics and have run into some trouble understanding computing confidence intervals and am seeking some help. I will outline the motivating example in my textbook and hopefully someone can offer some guidance.
Example
There is a population of mean values and your goal is to figure out the true mean (as best you can). In order to accomplish this, a number of samples are taken, each of which has a mean value.
Next, because we know by the central limit theorem that as the number of samples increase, the sampling distribution will be normally distributed, we use the equation $z = \frac{X - \bar{X}}{s}$ (noting that in this case s = standard error) to compute a lower and upper bound taking each sample mean as the mean for the z-score equation and z-scores of -1.96 and +1.96, for example, to compute a 95% confidence interval.
I’ve included a graph from my textbook in attempt to add clarity.
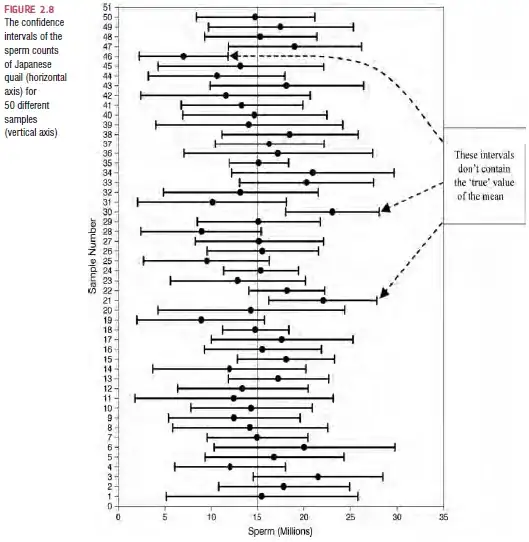
So I do not understand how it is you can use each sample mean as the mean value in our z equation to compute intervals. We know that the sample distribution is normally distributed so isn’t it the case that only the mean of all the samples can be used? How can we compute an interval around each mean value that contributes to the sampling distribution?
Any help with this would be much appreciated
Note: I'm reading "Discovering Statistics Using IBM SPSS Statistics 3rd Edition" by Andy Field and this example is from pg 43-45