I am fitting a generalized linear model (glm). The explanatory variable is categorical with three levels (control, treat1, treat2). The response variable is 0 or 1. The response rate for each treatment level is ploted as the figure below (from left to right: control, treat1, treat2):
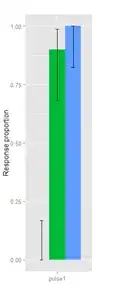
There seems to be a big treatment effect between treat1 vs. control and treat2 vs. control. I applied glm:
fit <- glm(response ~ treatment, family = binomial, data = dat)
Coefficients:
             Estimate Std. Error z value Pr(>|z|)
(Intercept)   -21.57    6536.57  -0.003    0.997
treat1        23.76    6536.57   0.004    0.997
treat2        43.13    9364.95   0.005    0.996
The z-test shows that neither treat1 nor treat2 is significant compared to the reference level control.
However, the analysis of deviance confirmed that the treatment factor as a whole is highly significant:
drop1(M2, test="Chisq")

response ~ treatment
            Df   Deviance    AIC    LRT  Pr(>Chi)
 <none>          13.003    19.003
 treatment   2   77.936    79.936 64.932 7.946e-15 ***
How shall I interpret such a strange result? Why does the individual z-test not give me any significant result, while according to the plot there is obviously an effect between treat1 and control, and between treat2 and control?